

Enhance your investments and trading strategy with our indicators. Optimize your Entry Points. Extend your Take Profits. Minimize your Stop Loss.
Wyoming, USA
Joined December 2020
- Tweets13.7K
- Following411
- Followers10.7K
- Likes3.1K




Pinned Tweet
Bitcoin
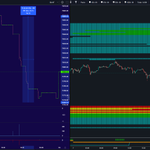
You may have heard us say that the crypto market "lacks liquidity." 80% of the time, the price is manipulated to liquidate positions. We explain why this happens, the battle between bots, and how this affects your trading.

Por debajo de los 75K, #Bitcoin tiene una importante concentración de liquidez de operadores en long.
Ante un aumento de la volatilidad, esta zona podría convertirse en su próximo objetivo.
Saber dónde pierde la mayoría permite tomar ventaja y operar con mayor probabilidad.
Liquidation Heatmap es la herramienta ideal.
tradingdifferent.com/es/dash…

Los fines de semana, la volatilidad de #Bitcoin suele disminuir. Los bots de alta frecuencia reducen su actividad y, con ello, su influencia en los movimientos bruscos del precio a corto plazo.
tradingdifferent.com/es/dash…

Trading Different retweeted

📍 bitcoin:native | ¿Qué nos trajeron los ETF de Bitcoin en noviembre?
Primera semana del mes, 4 de 5 días con salidas netas:
🔻 −16.838 BTC en total.
🏦 El vendedor tiene nombre: IBIT (BlackRock), con −15.696 BTC. Vendió los 5 días y explica el 93% de la salida.
🟢 Del otro lado, FBTC (Fidelity), con +1.052 BTC. Compró en 4 de los 5 días.
Cruce con el precio:
📈 4 nov: el único día de entradas (FBTC +2.940 BTC). BTC subió a 81.180.
📉 5 nov: la venta más amplia, con 6 fondos en negativo al mismo tiempo. El precio cayó casi un 7%.
📉 6 nov: IBIT vendió 5.314 BTC. El precio fue al borde del bloque de largos del mapa, en 74.825.
En proporción, lo que salió es apenas el 1,3% de los ≈1,27 millones de BTC que tienen los ETF: presión vendedora, no un abandono.
En los días clave, los flujos de los ETF y la liquidez apalancada empujaron en la misma dirección.
Solo comunicamos DATOS… el análisis e interpretación es 100% tuyo.
Lo viste aquí, en La Ruta del Precio.
No es asesoramiento financiero.
Trading Different retweeted
📍 bitcoin:native | ¿Todos los mapas de liquidaciones son iguales? No.
Este es el mapa de Hyperliquid de Trading Different. Hyperliquid es un exchange descentralizado: las posiciones son públicas. Por eso acá no ves estimaciones, ves liquidaciones reales de operaciones reales.
🔹 Cada línea es una posición: nace cuando se abre y se corta cuando se cierra o cuando el precio la liquida.
🔴 4 nov: el precio fue a buscar un cluster rojo, bajó hasta 75.690 y la línea se cortó. Desde ahí, el rebote.
🖱️ Con el cursor ves la posición: tamaño, apalancamiento y precio de entrada.
🐋 Con doble clic ves cómo opera ese trader. Como esta ballena: 100% en largos, más de USD 60 millones en posiciones y el 99,99% del margen en uso. El 6 nov siguió comprando cerca de 75.750. Su liquidación, en 71.885, se ve en el mapa.
Vamos a seguir de cerca la actividad de esta ballena.
Cuando te digan o leas que todos los mapas son iguales, recordá que no es verdad.
Solo comunicamos DATOS… el análisis e interpretación es 100% tuyo.
Lo viste aquí, en La Ruta del Precio.
No es asesoramiento financiero.
📊 #BTC | Wall Street dumped 16,838 BTC this week. Where were you looking?
Bitcoin spot ETF flows · Nov 6: –5,431 BTC
IBIT: –5,314 BTC
BITB: –270 BTC
ARKB: –265 BTC
GBTC: –146 BTC
FBTC: +564 BTC
(Checked: –5,314 – 270 – 265 – 146 + 564 = –5,431 BTC)
Week of Nov 2–6:
Nov 2: –5,189
Nov 3: –1,492
Nov 4: +927
Nov 5: –5,653
Nov 6: –5,431
Total: –16,838 BTC. 4 of the 5 sessions were red. BlackRock alone sold over 5,000 BTC on Friday.
Meanwhile BTC dropped from $81K to $75.8K, and retail leverage is already back near pre-crash levels.
Institutions are leaving, leveraged traders are reloading, and the map shows exactly where those positions would get liquidated.
You can’t trade what you can’t see.

📊 #BTC | The quietest Saturday of the month. And that’s the problem.
BTC has been glued to $75.8K for two days, just above the $74.8K low.
🔹 Volume: $59M this hour vs. a $357M average. Roughly a sixth.
🔹 Coinbase spot: 3.8M. Almost nobody is buying.
🔹 Hyperliquid: 5M, the lowest in weeks.
🔹 Liquidations: $681. Basically zero.
🔹 Open Interest: flat at $38.2B. The leverage from before the crash is still in the market.
Low volume doesn’t mean low risk. The positions are still there, waiting for a move to trigger them. On our map, the biggest long block sits just ~1.3% below price, at ~$74.8K.
You can see where it’s stacked before the market goes looking for it.
The market isn’t random. It hunts liquidity. Stop trading blind.

Trading Different retweeted

Mira esta mecha de hoy en bitcoin:native
El precio fue justo a tu stop y después se dio vuelta. No fue mala suerte 🤷♂️
Una sola liquidación te cuesta más que un año de esta herramienta.
El mercado no se mueve aleatorio, caza liquidez... pero se necesita algo tan preciso que solo nuestros mapas te pueden brindar.
Lo que la mayoría llama manipulación tiene un patrón. Y se ve.
Hablábamos de liquidation heatmaps desde 2019, cuando nadie sabía qué eran.
🔥 Accedé al free trial en Trading Different.



📊 #BTC | Fidelity bought on Tuesday. On Wednesday, it sold everything again.
Bitcoin spot ETF flows · Nov 5: –5,653 BTC
FBTC: –2,627 BTC
IBIT: –1,380 BTC
GBTC: –656 BTC
EZBC: –432 BTC
HODL: –310 BTC
ARKB: –248 BTC
(Checked: –2,627 – 1,380 – 656 – 432 – 310 – 248 = –5,653 BTC)
Every fund that moved was a seller. It came on the same day BTC dumped from $80.7K to $74.8K.
Just 24 hours earlier, Fidelity had bought 2,940 BTC. Then it flipped and sold 2,627.
When the biggest players can’t make up their minds, the market gets violent, and the ones who pay for it are traders flying blind.

⏳ Last day of Cyber Monday: 40% OFF, code cyber26.
👉 tradingdifferent.com/dashboa…
#Bitcoin #ETF #Crypto #BTC
📊 #BTC | The flush happened. The leverage came right back.
On Nov 5, BTC dumped from $80.7K and wiped out ~$100M+ in longs. Open Interest dropped to ~$37B.
24 hours later:
🔹 OI is back to $38.7B, almost where it was before the crash.
🔹 Price is stuck at $75,796, ranging just above the $74.8K low.
🔹 Today’s dip got bought on Coinbase spot (~90M spike), but derivatives are piling in again.
The same traders who got liquidated are reloading, and our map shows exactly where: a thick long block sitting right under price, ~$74.8K.
The market isn’t random. It hunts liquidity. Stop trading blind.

⏳ Last day of Cyber Monday: 40% OFF, code cyber26.
👉 tradingdifferent.com/es/dash…
#Bitcoin #BTC #Crypto #Liquidations
Trading Different retweeted
📍 Actualización de mapas | 5 criptos · 1H
Hace unas 20 horas te mostramos cinco criptos con bloques de largos apalancados esperando debajo del precio. ¿Alguna fue a buscarlos?
🟠 bitcoin:native: fue la que más se acercó. Marcó un nuevo mínimo en 74.810, justo en el borde de su núcleo (74.706), y rebotó. Hoy está a −1,4%.
⚪ $ETH: lateral, con el bloque cerca de 2.170 (−2,6%).
⚪ $BNB: lateral, con el bloque intacto cerca de 672 (−3,1%).
⚪ $HYPE: rebotó, pero el bloque sigue abajo, cerca de 73,5 (−5,9%).
⚪ $ADA: la más lejana, a casi −8% de su bloque (0,1706).
Cinco bloques. Ninguno liquidado, todavía. Todos siguen cargados.
La liquidez no tiene apuro: el mapa te muestra dónde espera.
Comunicamos datos. El análisis es todo tuyo.
No es asesoramiento financiero.
Simple Map permite visualizar de forma sencilla las principales zonas de concentración de liquidez. Identificar dónde está concentrada la liquidez permite anticipar posibles objetivos del precio y operar con mayor contexto.
Ejemplo #Bitcoin
tradingdifferent.com/es/dash…

¿Sientes que el mercado está en tu contra?
Opera con herramientas de uso real.
Liquidation Heatmap y High Frequency permiten identificar dónde está la liquidez y anticipar los movimientos del precio. #Bitcoin
Ejemplo:
tradingdifferent.com/es/dash…


Trading Different retweeted
📍 bitcoin:native | Capítulo 5: los ruteros de la noche
Abrimos el Mapa de Liquidaciones de Trading Different en 5 criptos. En las 5 hay largos apalancados esperando debajo del precio.
🔻 ADA · 0,170962 (−7,5%)
🔻 HYPE · 73,635 (−5,4%)
🔻 BNB · 672,07 (−3,2%)
🔻 ETH · 2.169,54 (−3,0%)
🔻 BTC · 74.742 (−1,8%)
Cuanto más grande la cripto, más cerca tiene a sus largos.
Guarda este post: mañana volvemos con lo que hizo cada una.
Trading Different retweeted
¿SOLANA A LOS $85? 👀
🔴 Mirá el análisis EN VIVO youtube.com/live/v36GkbE2S_g

Trading Different retweeted
#Nasdaq cerró la jornada con una caída del 6%.
Esto aún no acaba, está liquidando una gran concentración de posiciones apalancadas en long.
El viernes continuará con esa tarea, y panorama es negro.

BTC on #Hyperliquid 15m Chart 📊
Bitcoin is pulling back sharply today, erasing all the gains made during the previous session. 📉
To the upside, the liquidation cluster is concentrated at 79,550 USD, establishing a target level in the event of a potential bullish impulse. 🚀
To the downside, the support zone and accumulated liquidity sit at 73,400 USD, a key level to watch if the corrective move extends. 🧲
Check the Heatmap here:👉 tradingdifferent.com/es/dash…
#BTC #Bitcoin #Crypto #Trading #PriceAction
