

Ex-sell side/buy side. Spent years writing research nobody read on stocks everybody owned. Now writing research people actually want on stocks nobody covers.
England, United Kingdom
Joined March 2026
- Tweets205
- Following292
- Followers1.9K
- Likes271




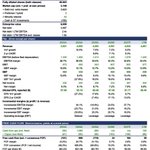


One-pager: Evolution (EVO SS). Cheap, but not yet asymmetric
This came out of a screen of European consumer names with market caps of €3–20bn. I was looking for companies trading below their own history while estimates hold up. Evolution passed the first test clearly and the second one partly.
The numbers (SEK 841, 26 Oct)
CY27 P/E of 12.5x vs a 5-year average of 17.5x
CY27 EV/EBIT of 10.9x vs a 5-year median of 14.1x
FCF yield of about 7.6% on consensus, after all capex and lease payments
Adjusted EBITDA margin of about 66%
Net cash of about €0.5bn, or close to zero if you treat the net current tax liability (about €0.4bn) as debt-like, which I do
What looks priced in
A 7.7% FCF yield on EV implies roughly 1% perpetual growth at a 9% cost of capital. A rough sum of the parts gives the same answer. Value everything outside Asia at 15x EBIT, and the market is paying about four years of profit for Asia.
What's actually happening
Q3 revenue grew 3.7%, the first year-on-year growth in five quarters
North America, LatAm and Africa make up about 30% of revenue and are growing in the high teens or more
Europe revenue is down about 14% over eight quarters, though it was flat in Q3
Asia, about 37% of revenue, has been flat at €190–198m a quarter for five quarters
About 49% of revenue comes from markets the company classifies as regulated
Risks
Asia and compliance. A company-commissioned review (Spectrum, 2022, disclosed in US litigation) found Evolution's games were played in prohibited markets because of compliance deficiencies. The company's position is that operators choose their markets. The risk I'd weigh most is not local enforcement but licensed regulators treating this as a suitability issue. The UK settled with Evolution as a supplier in 2026, which sets a precedent.
Brazil. The studio closed after the provisional ban, and the incumbent president was re-elected on 25 October, so I assume a prolonged loss.
Estimates. CY26 EPS consensus is down 5% over 12 months, though flat over three.
The Street. The median price target (SEK 725) is about 14% below the share price.
Cash flow quality. Reported operating cash flow benefits from tax deferral: tax paid was €75m in 2025 against a €184m charge.
Shareholder structure
Kenneth Dart's Candle Lake holds about 34% after a mandatory bid at SEK 695, which was below market. I read that as a floor, not a takeover premium. Buybacks keep increasing his stake and shrinking the free float.
Risk/reward
Bull, SEK ~1,100: Asia holds, Brazil reopens, 15x CY27 EPS
Base, SEK ~910: consensus EPS at 13.5x
Bear, SEK ~545: Asia down 25%, no Brazil, 10x
The probability-weighted value is SEK ~870, about 3% above today.
Probability-weighted R/R is 1.3x against my 3x hurdle. It clears at around SEK 760, or at today's price only if you're confident the SEK 695 bid holds as a floor.
Conclusion: watchlist, not a position. It's a cheap, highly cash-generative business, but at this price the downside scenarios aren't well enough protected.


Having lived in both the US and Europe, I can absolutely attest to this.
I think the mistake people make is comparing gross salaries rather than the cost of replicating the same quality of life.
The US unquestionably offers greater earnings potential, particularly in certain professions. But once you factor in housing, healthcare, childcare, transport and, importantly, the value of your time, the equation changes quite dramatically.
And it’s not as though London is particularly cheap either.
But the broader point resonates. Once you’ve experienced a lifestyle where more of your time is genuinely your own, you start to appreciate that not everything can be solved by earning another $100k.
At some point, the marginal utility of another dollar is worth considerably less than the marginal utility of another hour with your family.

An interesting theme lately in the American expat community in Western Europe, especially higher earning corporate types (e.g. €200-300K/year), is the feeling of being unable to move back home to the US.
Few reasons...
Many who moved in the years after COVID sold their homes when rates were closer to zero than the rates now. Now that same home is ~20% more expensive while mortgage rates are 2x higher. So the monthly cost of housing like-for-like went up literally 100% in just 3-5 years.
They've gotten used to the European way of life (e.g. no or maybe just one car, easy train and airport access) and its far less intense commercial and career culture... so fewer working hours and more vacations and significant employee protections (i.e. hard to be fired legally).
This is great while living in Europe... a €250K household income is massive even post-tax considering the low relative cost of health care, education, transport, housing, etc...
...but dropping themselves back into US society... especially in a major metro area like NY, SF, Chicago, even Miami now... at age 40-50 with kids... is largely impractical.
Many Europeans would be shocked to learn that ~$250K/year in the US is incomparable to that same level of earnings in a major Western European city like London or Amsterdam or Paris.
I'd estimate the income needed in the US to match the overall quality of life you'd enjoy in one of those European cities... is around $500-750K/year.
Wild.
Luceco (LUCE LN): some notes on why I think the market is pricing a one-year problem as a permanent one.
For anyone unfamiliar: Luceco makes everyday electrical products for UK homes and buildings. That covers sockets and switches (BG), consumer units, lighting, Masterplug extension leads and, increasingly, EV chargers. Most of it is made in its own factory in Jiaxing, China. FY25 revenue was £271m and adjusted EBIT £33.8m. About 60% of sales go into residential repair and improvement, and only 5% into new-build housing.
The near-term issue is copper. In sterling terms it averaged about £7,550/t in 2025 and is running at about £10,200/t for 2026, up roughly 35%. The forward curve is flat at around £10,700/t through 2028.
Luceco hedges, so FY26 has been largely protected. H1 gross margin held at 41.9%, and guidance is for adjusted EBIT ahead of £40.9m. My estimate is about £43m. The company has met or beaten opening-year consensus every year since 2019, by around 5% on average.
FY27 is where I think the numbers are too high. I back-tested gross margin against copper, CNY and freight over FY19–25. The best fit has most of a copper move hitting the P&L about a year later, with only 20–40% recovered through price in the year itself. On that basis FY27 gross margin falls from about 41.7% to about 39.3%. I get FY27 EBIT of about £41.6m, against Bloomberg consensus of £43.3m, which still has profit growing.
The 2021 rally is a useful reference. Copper rose about 41% in sterling. Gross margin fell 2.7 points that year and another 1.1 the next, then fully recovered by 2023 as pricing caught up. I expect a similar pattern, with FY28 EBIT rebounding to about £50m.
So my view is below consensus for FY27, but I think the share price already reflects something worse.
At 202p the stock is on about 9x FY27 EV/EBIT using my below-consensus numbers, with about a 7.7% FCF yield. That compares with a five-year average of 9.9x and a peer median of about 11.9x. On a simple reverse DCF (10.4% WACC, 2% terminal growth), today's price implies either:
an EBIT margin of around 11% indefinitely (12.5% in FY25), or
revenue growth of around 2.5% a year to 2030 (9.6% a year over FY22–25).
A few other points matter beyond copper:
Outgrowth: Luceco has grown about 4 points a year faster than its end markets, based on ONS construction output weighted to its own mix. That excludes 2022, when customers destocked and Luceco fell 20% while the market grew. In H1 26 the gap was about 3 points.
EV chargers: EV charging and Demand Flexibility have gone from about £10m of revenue in FY24 to about £34m this year, roughly 11% of the group.
Management talked about c.75k chargers for 2026. Demand Flexibility income per charger was cut in Q3, so I model it at a much lower level from FY27.
Returns: ROIC is mid-to-high teens, which puts it with Volution and Howden rather than the lower-returning UK building-products names it trades alongside.
New CEO: Dr Thorsten Müller, ex-Halma, took over in September. His stated focus is capital allocation and a leaner structure, with a strategy update due at the March 2027 results.
Things that could make me wrong:
UK rates and housing: RMI turns down in 2027 as rate expectations rise. Mortgage approvals are already down about 16% from April.
Demand Flexibility: further regulatory changes to flexibility payments.
Copper: it keeps rising, or price increases don't stick.
Destocking: a repeat of the 2022 trade destock.
Supply overhang: EPIC/ESO (28%) and the founder have been selling shares.
The other direction: Luceco simply beats again and FY27 is fine.
Probability-weighted, that's about 277p, or around 37% above the current price.
The bear case deliberately combines a destock with a further copper rise in the same year.
The likely flashpoint is FY27 guidance at the March results. If that comes in below consensus, I'd expect it to be the low point for sentiment rather than the start of a longer decline.


Having reached Director on the sell side before making the move to the buy side, I think this is very good advice.
One thing I’d add is that the skills that make you successful at one stage of your career aren’t necessarily the ones that make you successful at the next.
On the sell side, you can be an exceptional analyst, but as you progress, the job increasingly becomes about building a franchise, developing client relationships, generating commercial value and managing people. Being a great stock picker isn’t necessarily what makes you a great MD.
Equally, moving to the buy side requires a different skill set. Having a good investment thesis is one thing. Translating that into a position, sizing it appropriately, managing risk and knowing when you’re wrong is another entirely.
My advice would be to spend less time looking at the titles of people above you and more time understanding what they actually do every day. Then ask yourself whether that’s a job you’d genuinely enjoy doing for the next 10–20 years.
And don’t confuse being capable of reaching the next rung with it necessarily being the right rung for you.
There’s a lot to be said for knowing what game you’re best suited to play, rather than simply trying to climb the highest.

Once you hit the 2nd year associate level in finance you should have an honest conversation about what type of work you can do for the rest of your career.
Aka, examining your competency. What you want to do should = what you CAN do. Try answering the following:
What are you actually good at, how intense of a shop do you want to work at, where do you want to live, do you want to be buyside, do you want to work in the private markets or public markets, equity or credit, are you talented enough to become MD/VP, do you want to do AI instead, do you want to buy a SMB in the future, will you get promoted here, are you actually good at your job/are the other ppl your age better than you etc.
What’s important to remember is not everyone becomes an NFL head coach. Theres only 32 head coaches. 32 offensive coordinators, 32 defensive coordinators. Not all coordinators are suited to become a head coach and the same thing is applicable in finance.
One thing I’ve learned covering restaurants is that perfectly rational decisions at the company level can produce some fairly irrational outcomes at the industry level.
Take store expansion. One operator identifies an attractive catchment and opens a restaurant. A competitor responds because it doesn’t want to surrender market share. Both have perfectly reasonable arguments for investing.
A few years later, the catchment has more restaurants than it probably needs, volumes are spread across too many sites, and neither operator is earning quite the return it originally anticipated.
I’ve been wondering whether we’re watching a much larger version of this play out in AI infrastructure.
For Microsoft, Google, Amazon and Meta, the consequences of underinvesting could be enormous. If AI becomes the next major computing platform, losing your position today might be exceptionally difficult to recover from.
So everyone keeps investing.
Individually rational. Collectively, perhaps not.
Now introduce Jevons’ paradox. As inference gets cheaper, consumption should increase. But I think there’s a tendency to jump from that observation to the conclusion that the current infrastructure buildout must therefore generate attractive returns.
I’m not sure that necessarily follows.
Token consumption, revenue and returns on invested capital are three very different things. Usage could explode while falling prices and improving hardware productivity undermine the economics of providing that compute.
There’s also an interesting asymmetry in the timing. The companies supplying the chips, power and equipment can enjoy exceptional economics during the buildout, even if their customers ultimately struggle to earn an adequate return on that infrastructure.
Which brings me back to the original question.
Are hyperscalers investing because the economics justify it, or because the strategic consequences of not investing are simply too great?
I suspect the answer is some combination of both.
But the distinction matters enormously if you’re trying to work out where the economic value from AI ultimately accrues.

I think there are two separate dynamics being conflated here. The compute required to build an agentic workflow and the compute required to run it once mature aren’t necessarily the same thing.
The more interesting question is whether the growth in the number of workflows and their frequency of execution more than offsets the declining compute cost per task.
Ramp’s latest data are fascinating in that regard. Token volumes are still growing rapidly, but spending is growing considerably slower as unit costs fall.
That strikes me as an important distinction for anyone underwriting the infrastructure buildout. AI could become enormously successful as a technology without the economics necessarily accruing to the providers of compute.
Jevons might well win on consumption. Whether he wins on revenue, pricing power and returns on invested capital is another question entirely.

I think there’s something to this. Credit has a way of becoming reflexive, particularly when liquidity starts disappearing. A handful of genuine credit problems can trigger losses and redemptions, forcing investors to sell what they can rather than necessarily what they should.
Perhaps what is worth monitoring is whether the widening starts migrating from the weakest credits into otherwise healthy borrowers with limited near-term refinancing needs. That’s when you potentially move from a fundamental repricing of default risk to a technical dislocation driven by the marginal seller.
Of course, the uncomfortable part is that technical stress can eventually become fundamental. If the refinancing window stays shut long enough, the market can create some of the credit problems it was originally trying to price.

Really good post. I think one of the most important distinctions here is between the economics of an industry and the economics of the individual businesses participating in it.
The history of capitalism is littered with examples of enormous value creation for consumers and remarkably little value capture for the providers of that innovation. Competition has a habit of transferring the benefits of technological progress to the customer.
But I’d be careful about treating the entire AI infrastructure stack as one homogeneous business. A hyperscaler with an established distribution network, captive demand and a software ecosystem is underwriting a very different set of economics to a leveraged provider of relatively interchangeable compute capacity.
I also think there’s an important distinction between returns on existing capital and returns on incremental capital. During a period of extraordinary demand, almost any capacity can look valuable. The real test comes when supply normalises and the next dollar of investment has to compete against increasingly efficient technology and potentially lower unit pricing.
And falling compute costs aren’t necessarily bearish for everyone. They could substantially expand the addressable market through greater consumption, while simultaneously compressing the returns available to the infrastructure providers. Both things can be true.
Perhaps the most useful Buffett/Munger lens is to ask who has the ability to not reinvest the next US$10bn and still retain their competitive position.
Because if maintaining your earnings power requires continuously replacing increasingly obsolete assets, the economic owner earnings may be considerably less attractive than the reported growth suggests.
Of course, even a wonderful business can be a terrible investment at the wrong price, just as a mediocre business can be a fantastic investment at the right one.
Ultimately, being right about AI adoption is only the first part of the underwriting exercise. Figuring out who captures the economics, how much capital they need to do so, and what you’re paying for those future returns is where the actual investing begins.

What if everyone is right about AI but wrong about the investment?
This will probably get under the skin of quite a few people, particularly those heavily invested in AI infrastructure businesses. But I would encourage everyone to put their biases aside for a moment, forget about the stocks they own, and examine these businesses from a bird’s eye view. Are they truly extraordinary businesses with wonderful economics, sustainable competitive advantages, pricing power, and high returns on capital? Or are we confusing extraordinary demand for something with the existence of an extraordinary business?
I think this is something too many investors overlook. History is filled with industries that transformed the world and experienced tremendous growth, yet many of the businesses operating within them struggled to generate attractive returns for shareholders. Airlines revolutionized transportation, telecommunications connected the world, and railroads transformed economies, but that didn’t automatically make the companies wonderful investments. Just because the world desperately needs something doesn’t mean providing it is an extraordinary business.
When I examine AI infrastructure businesses, I see extraordinary demand and revenue growth, but also staggering capital requirements, huge financing needs, and expensive equipment that becomes outdated surprisingly quickly. Unlike businesses that can grow enormously without requiring much additional capital, these companies need to spend billions simply to expand their capacity. And eventually, actually rather quickly, much of that equipment will need to be replaced. So how much of this impressive growth will actually translate into cash that belongs to shareholders?
Consider depreciation, which I think is one of the most underappreciated aspects of these businesses. Imagine a company purchases $10 billion of computing equipment and assumes it will remain economically useful for 5 years, resulting in $2 billion of annual depreciation. But if the equipment’s actual economic life turns out to be 4 years, that annual economic cost increases to $2.5 billion. That’s a $500 million difference simply because one assumption about the useful life of the equipment changed.
And here’s something even more fascinating. The same technological advancements making AI increasingly powerful may simultaneously make existing computing equipment less competitive. If tomorrow’s equipment delivers twice the computing power for the same price, what happens to the economics of yesterday’s infrastructure? Technological progress can create extraordinary value for society while simultaneously destroying some of the economic value of the assets purchased to support it.
Then there’s pricing power, which deserves considerably more scrutiny. When demand exceeds supply, providers can enjoy attractive prices, but that doesn’t establish a durable competitive advantage. What happens when competitors expand capacity, supply catches up to demand, and customers gain more alternatives? Will these businesses retain attractive pricing, or will competition eventually transfer much of the economic benefit to customers in the form of lower prices?
I’m also fascinated by the enormous emphasis on EBITDA and revenue growth. Imagine a company invests $10 billion in infrastructure and generates $3 billion in annual EBITDA, which sounds extraordinary until you subtract $2 billion in economic depreciation and $600 million in financing expenses. Suddenly, you’re left with just $400 million in pretax earnings. The business hasn’t changed, but your understanding of its economics certainly has.
1/👇
A few thoughts on Domino's Pizza Group (DOM LN), which I find a bit puzzling at the moment.
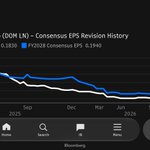
The shares are up ~25% YTD, but as far as I can tell almost all of that has come from the multiple. The 12m forward P/E has moved from roughly 9.5x at the start of the year to ~11.7x today, while consensus EPS has barely changed. FY27 sits at 18.3p and has been broadly flat since the summer, having drifted down steadily from ~26p in early 2024. So the market is paying more for the same earnings, rather than rewarding upgrades.
On the fundamentals, the business looks fairly mature to me. Growth has been hard to come by for a while now. The newer chicken offering appears to be helping at the margin, and that's worth acknowledging. My hesitation is the longer-term competitive picture: as Chick-fil-A and Canes build out their UK presence, I think they're likely to be stronger in that category over time.
It's also notable that the previous CEO, a former franchisee with a strong operating reputation, wasn't able to move the needle meaningfully. That makes me cautious about how much operational upside is left to unlock.
The main counterpoint is cash generation. The FCF yield is high (>12%), and for some investors that alone may justify a higher multiple, particularly if it supports continued returns to shareholders.
On balance, without earnings revisions turning, I find the rerating difficult to underwrite. Feels like a short opportunity IMO. Happy to hear other views, especially from anyone who sees a catalyst I'm missing.


mostly agree with this but I think people are overcorrecting a bit. the model was never really where the edge was, the good analysts I've worked with could build one fine but what made them good was knowing which 2 or 3 lines actually mattered and why
the intangibles stuff is right too, accounting is pretty useless at capturing it (Baruch Lev's The End of Accounting makes it at length) but it does show up in the numbers eventually, you see it in returns on capital, incremental margins, how much they can reinvest and at what rate. so I'd still want the spreadsheet, just as a way of checking whether the "network of know-how" story is real or just a nice narrative
AI building the 3 statement in 2 mins is great tbh, means more time spent on the bit that actually matters

if you're into "financial models", pivot to ontologies. You need to think about firms as networks of complementary knowledge and know-how, not as a bunch of numbers on a spreadsheet. Accounting doesn't give you any view into the thing that actually matters (and will matter more and more going forward): how intangibles combine to create economic value.
Firms with economically valuable configurations of knowledge / know-how can deploy capital at attractive returns. Those with a differentiated ability to learn from deployment (accrue more economically valuable knowledge/know-how) absorb more capital over time.
Organisms / species with adaptive mutations absorb energy at high rates and use that energy more efficiently (become more selectively adaptive).
Are you getting it now?
I've been trying to understand the unit economics of a single $CRWV contract, prompted by this GS note arguing new contracts clear a ~15% unlevered IRR. I rebuilt that maths as a simple model and flexed the assumptions. Some observations below. Very open to being told where it's wrong.
Setup: one 200MW contract with capex up front and a 5-year term. 80% is debt-funded through self-amortising asset-level loans (the DDTL structure). Outputs are unlevered IRR, equity IRR, DSCR and breakeven revenue per MW.
1. The ~15% reproduces, but it's sensitive. At $13m/MW of annual revenue and $30m/MW of capex, I get about 15% after tax. At the current blended ~$10m/MW it's closer to 6%. The breakeven for 15% is about $12.9m/MW, so the base case sits close to the hurdle.
2. Price and capex matter about equally. Roughly, +$1m/MW of price adds 3pts of IRR, and +$2m/MW of capex takes off 2.5pts. Newer GPU generations raise both.
3. With updated inputs, returns look close to the cost of capital. I used $12m/MW pricing, $34m/MW capex, a 3-month ramp, some re-lease value and minimal cash tax given the NOLs. That gives about 11–12% unlevered, against an estimated project cost of capital of about 11%.
4. Financing terms make a big difference to equity returns. The same contract funded at IG-style spreads, rather than the wider levels on recent facilities, moves equity IRR from about 15% to about 25%.
5. Vera Rubin economics are the part I'm least sure of. On my capex estimate (~$40m/MW), a 5-year contract returns about 9%. Longer contracts and meaningful residual value bring it to the mid-teens, so the assumption about GPU useful life carries a lot of weight.
6. For context, the parent's unsecured bonds have widened sharply recently, while the asset-level debt has held up much better.
Caveats: this is one stylised contract, not the company. The capex per MW for new generations is an estimate. And the tax and debt-draw treatment are simplified.
If you work on this area and see something off, particularly on capex/MW or contract pricing, I'd genuinely like to hear it.


Goldman upgrade $CRWV to buy as they realize per unit economics good/ progressing positively vs trailing. some strangely familiar points in the upgrade note, interesting -- interesting


I built a cohort model for $CRWV: each year's capex earns contracted revenue, is part-funded by self-amortising secured debt (DDTL-style) and customer prepayments, and anything left over has to come from unsecured debt or equity. It's calibrated to 2026–28 consensus revenue, current depreciation and the H1 2026 loss.
One thing matters a lot here: gross versus cash capex. In 2025, net PP&E rose ~$18.7bn while cash capex was ~$10.3bn; much of the rest was vendor-financed. On a gross basis, each $1 of capex currently supports roughly $0.30 of annual revenue.
The per-dollar maths, roughly:
~$0.30 revenue × ~62% EBITDA margin ≈ $0.19 of EBITDA
minus ~$0.17 of depreciation (6-year life)
minus ~$0.05 of interest
What would change it:
1. Pricing on new contracts. Breakeven at a 6-year life needs roughly $0.36 of revenue per $1, ~20% above today. Recent price increases on new deals point that way.
2. Hardware life. If GPUs keep earning for 8–9 years, today's ~$0.30 is roughly enough. CoreWeave has said some A100s are contracted through 2029.
3. Funding mix. More investment-grade, contract-backed debt like DDTL 4.0 rather than 14–15% unsecured.
Model output
Consensus-like base case: no profit by 2033, ~$100bn+ of cumulative unsecured/equity funding needed
Bull case (higher pricing, 7-year life): profitable now, largely self-funding
What I think is most likely: somewhere between the two, closer to the base case for the next two years.
New contracts look better priced than the existing book, and contracted hardware is likely to earn beyond six years. Both point toward eventual profitability. But the benefit arrives gradually, as older cohorts roll off and newer ones ramp. Meanwhile, capex of $35–50bn a year leaves a residual funding need, likely ~$10bn+ a year through 2027–28, beyond what secured debt and prepayments cover.
So the likely path isn't default, and it isn't a smooth self-funding story either. Expect continued issuance of converts, notes and possibly equity, more structured secured deals, and customers and partners stepping in through prepayments. CoreWeave probably gets there, but existing unsecured holders and shareholders bear the cost through dilution and expensive funding along the way. Notes in the low 80s yielding 14–15% look broadly consistent with that.
The real test comes around 2030–31, when the first large contracts end and re-lease rates show what these GPUs actually earn in their later years.
Caveats: the model is simplified. Part of 2025's additions are data centres not yet earning, margins may expand as consensus expects, and revenue per dollar is held flat. Q3 results on Nov 10 will give a better read on revenue against the growing asset base, and on any change to useful lives.


Does anyone have a thesis as to how/when $CRWV becomes profitable and is able to pay down debt?
The argument that if they were to stop investing/building they would be cash flow positive is irrelevant.
If they stopped building every competitor would pass them by immediately
This is one of the better bull cases for compute I've read, and I agree with more of it than I disagree with. But I think it conflates two different things: the labs surviving, and the owners of compute earning a return.
Where I agree
The survival logic is right. A safety-focused lab that lets itself run out of money doesn't make the world safer. It hands its talent and compute to someone less careful. So commercial pressure probably does keep release cadence steady, and that does smooth fundamental volatility.
Where I'd push back
The argument is that the market keeps getting this wrong because most participants aren't believers and extrapolate linearly. The consensus numbers say the opposite. The market is already extrapolating, aggressively, on the spending side.
FY27 consensus revisions over the last 12 months:
GOOGL capex +215% / revenue +30%
AMZN capex +105% / revenue +10%
MSFT capex +93% / revenue +6%
META capex +89% / revenue +17%
ORCL capex +85% / revenue +8%
No name has revenue revisions within 50pp of its capex revisions.
You could argue some of that is new analysts initiating with higher numbers, and coverage did grow at GOOGL and AMZN. But MSFT and ORCL have stable analyst panels and still show roughly +90% capex against +7% revenue. The gap is structural.
Why the headline numbers flatter the picture
1. Capex is understated. Combined FY27E capex is ~$1.1T, roughly 47% of revenue, up from ~16% in 2024. That's on consensus cash capex, which excludes finance leases. Estimates puts MSFT's lease-inclusive CY27 spend ~$26B above consensus.
2. Depreciation hasn't arrived. 2027E D&A for the group is only ~27% of 2027E capex. Estimates expect group depreciation to roughly quadruple by 2030 from ~$103B in 2025. Most of this spend hasn't hit the P&L yet.
3. Book lives may be generous. Most of the group depreciates servers over 5–6 years, and most extended those lives recently. Amazon went the other way, cutting from 6 to 5 years, citing the pace of AI hardware change.
The best counter to point 3 is that AWS says it has never retired an A100. Fair, but physical life isn't pricing life. A GPU still running at a fraction of its original rental rate is not the asset that was underwritten.
What would change my mind
Revenue revisions starting to close the gap on capex revisions. GPU rental pricing holding up as new generations ship. Either would make the convexity argument much stronger.
The bottom line
If you're right that smarter models override adoption bottlenecks, the labs win. That doesn't automatically mean compute owners win. In every infrastructure buildout, demand turned out to be real, and returns still went to whoever had pricing power, not whoever built the most capacity.
The market isn't short on believers. It's already pricing in the spend. The convex bet isn't compute broadly. It's finding who keeps pricing power once the capacity arrives.

Most people worry that enterprise inertia will result in a slower ramp of lab monetization which will cause an oversupply of compute and an inability to achieve an ROI on expected capex.
Because I believe smarter models override human bottlenecks my concern is instead that safety concerns force the labs to take their time with releasing new models and that credit will dry up in the interim.
The reason why I’m not overwhelming concerned by this is because imho safety is inherently bound by the realism of capital markets.
If you’re Dario as much as you pay lip service to the notion that you will sacrifice financials for safety the truth is that if you let Ant or possibly even OAI go bankrupt you risk a dispersion of that talent and compute in a manner that increases p(doom) substantially as you lose the oversight of a central governing mechanism.
So labs are going to play the delicate game of releasing models that are close enough to aligned but not procrastinate because they need to ensure they survive long enough to be the responsible stewards of ASI they aspire to be.
That means that vol gets somewhat smoothed out between model releases.
And again because the delta between models available to the public vs what the labs have internally has widened over the last year the other major source of exogenous risk (scaling laws faltering) has effectively been taken off the table.
TBC market vol will continue because most market participants are not believers and therefore consistently linearly extrapolate but from a “fundamentals” standpoint I view being long the value of compute as incredibly convex.
Two books I keep coming back to, neither of them about investing.
Loonshots, by Safi Bahcall, argues that whether a company can keep backing odd, early ideas depends less on culture than on structure. As organisations grow, incentives drift toward rank and politics and away from results, and the ability to nurture new things quietly fades. For us, that shifts the question from what management says about innovation to how the business is actually organised and paid. Bahcall's idea of the "false fail" is also useful: a good idea that looks dead because of a flawed early test. Some of the more interesting setups sit there, in businesses or products the market has dismissed on thin evidence.
Range, by David Epstein, separates "kind" learning environments, where feedback is fast and clear, from "wicked" ones, where it is slow, noisy and often misleading. Markets are firmly the second kind. That makes a case for breadth: a wide stock of reference points tends to travel further than deep pattern-matching in a single sector. The habit we take from it is to ask what a company resembles outside its own industry. The most useful analogy is often in a different sector, or a different decade.
Neither book gives a formula. Both are good at sharpening the questions. Highly recommend both to anyone that wants a good read/trying to sharpen their toolkit.
Fincantieri (FCT IM) screened as the best setup on my list: down 47% from the high, EPS estimates up 23% in 3 months. Running it through my one-pager, the picture is more nuanced. Walk-through below.
Market cap €4.4bn on 358mm shares. EV about €6.35bn, using net debt as gross debt minus cash, plus roughly €600mm for the four underwater acquisitions announced in July.
What the screen flattered
Revisions. FY26 EPS is +23% over 3 months, but FY26 EBITDA consensus is flat. About half the upgrade is a one-off €23mm gain on the China JV stake; most of the rest is lower interest. FY27 is cleaner, with EBITDA +4%.
Valuation. The "36% P/E discount" uses a 5-year average distorted by the 2023 loss. On FY27 EV/EBITDA it's 6.9x vs. a 7.3x 5-year average, only 5% cheaper. The real discount is about 33% vs. defence peers at ~10.3x.
Leverage. The headline 1.0x is at 30 June, before the July deals. Pro forma it's 1.9x on the company's definition or 2.75x gross debt minus cash. That's before €891mm of supplier finance and up to ~€400mm more deal commitments.
FCF. Thin: 1.8% yield for FY26 and 3.1% for FY27, as capex nearly doubles.
What looks good
Firm backlog €43bn, about 4.7x revenue. The headline €73.9bn includes €30.9bn of soft backlog (options, letters of intent).
H1 EBITDA +12.5%, margin up to 7.6%.
Cruise orderbook running to 2039.
Catalysts
Portugal: 3 FREMM EVO frigates, ~€3.9bn. Government agreement signed in July; industrial contract pending.
Belgium: frigate decision due by year-end, with FREMM EVO reportedly favoured.
US Navy: initial work on 4 landing ships, with construction possibly starting in Q4 and up to 35 ships planned.
9M results on 12 November.
Scenarios (FY27 adj. EPS × P/E)
Bull €19.40 (+58%, 30%): defence orders land. Street-high €0.88 × 22x, still below defence peers on EV/EBITDA.
Base €13.90 (+13%, 45%): consensus €0.77 × 18x, back to the 5-year average EV/EBITDA.
Bear €8.10 (–34%, 25%): orders slip, integration and leverage bite. Street-low €0.58 × 14x.
Probability-weighted: ~€14.10, +15%.
Risk/reward
Bull ÷ bear: 1.7x. Probability-weighted: 2.8x, which crosses 3x at about €12.05. Bull ÷ bear needs about €10.90 to reach 3x.
Thanks to a reply on my last post, I now show both. Bull ÷ bear shows the raw range; probability-weighted puts the base case and my conviction into the number. When they diverge this much, as they do here, the answer depends heavily on your probabilities.
Verdict
A real defence re-rating option with concrete near-term catalysts, but the screen flattered it. It's the closest to 3x of the names I've run so far, but only on the probability-weighted measure. Watching Belgium and the 12 November print.


I use a simple one-pager to find interesting setups in equities. Same template every time, so names are easy to compare. Here's the framework, then a walk-through on Sixt.
The one-pager
Cap table. Price, diluted shares, market cap, net debt, EV.
P&L. Revenue, EBITDA, EBIT, EPS with YoY and 2-year growth, margins, and incremental margins.
FCF. FCF, FCF per share, FCF yield.
Estimate revisions. Consensus EPS vs. 1, 3, 6 and 12 months ago. Direction of revisions matters more than the level.
Valuation. P/E, EV/EBITDA, EV/Sales vs. the stock's own 5-year range.
Risk/reward grid. Bull, base and bear targets, then the R/R multiple (upside to bull ÷ downside to bear).
Checklist. Revisions up, multiple below history, growth accelerating, operating leverage, FCF yield above hurdle, R/R ≥ 3x. Score out of 7.
Walk-through: Sixt (SIX2 GY)
P&L. Revenue goes from €4.28bn (2025) to €4.59bn (2026E) to €4.84bn (2027E). EBT, the metric Sixt guides on, goes from €401m to €464m to €506m, taking margin from 9.4% to about 10.4%. Incremental EBT margin is about 21% in 2026, double the current margin. In H1 2026, EBT was +39% on +9% revenue.
Revisions. 2026 EPS is +2% over 3 months and +4% over 6 months, with 6 up and 1 down. But it's still –8% vs. 12 months ago. This is a recovery from a reset, not a fresh upgrade cycle.
Valuation. 10.2x 2026 and 9.3x 2027 P/E, vs. a 12.7x 5-year forward average. EV/EBITDA of 4.5x looks cheap, but it flatters every rental company because fleet depreciation sits below EBITDA. I lean on P/E and EBT.
Tailwinds: Sixt is taking share while Avis shrinks its fleet, industry capacity discipline supports pricing, fleet costs are easing, and the dividend yields about 5%.
Headwinds: jet fuel at around $140 is hitting airport travel, used-car values are rolling over in both Europe and the US (the 2024 margin hit was a residual value story), there was a Fed hike, the US consumer is weak, and consensus already sits at the top of 2026 guidance.
Scenarios (2027 EPS × P/E).
Bull, €119 (+64%): €8.80 EPS, 11.5% EBT margin, 13.5x.
Base, €89 (+24%): consensus €7.77 EPS at 11.5x.
Bear, €47 (–34%): a 2024-style margin reset to 8.4%, €5.93 EPS at 8x.
Probability-weighted (20/50/30): about €83, or +14%.
R/R grid. At €72.25, R/R is about 1.9x. It crosses 3x around €65.
Score: 5/7. Revisions positive, cheap vs. history, growth accelerating, operating leverage. Fails on FCF yield and R/R.
Verdict. Good company, cheap multiple, real operating leverage, but at today's price you're not paid 3x for the macro risk. I'm watching for the mid-to-low €60s, or a Q3 print that shows margins holding despite fuel and residual values.
Not investment advice. Just how I think through a setup.


Good framework. A couple of things I'd add.
First, some of the calm in the secured layer comes from how it's held. Much of the GPU-backed financing sits in private delayed-draw facilities that don't trade daily, so it doesn't show up as a price move the way public unsecured bonds do. That doesn't mean those lenders are worried. It just means the unsecured bonds are carrying most of the visible price discovery for the whole capital structure.
Second, the 15% on the unsecured makes sense once you look at the order of repayment. If the most valuable collateral is already pledged to the secured lenders, unsecured holders effectively have a claim on what's left after those loans are repaid. So that yield is less a judgment on whether the GPUs work and more a judgment on how much value remains after the secured layer is paid.
The thing I'd watch for the secured side is the gap between contract length and the useful economic life of the chips. As long as the contracts run longer than it takes the hardware to lose its pricing power, the structure holds up well. The point to watch is the next round of renewals, when current-generation capacity gets repriced against whatever comes next.

CoreWeave's debt, explained simply, because I like to speak plainly:
Secured debt = the mortgage. Backed by the house. The GPUs and the contracts they serve are the collateral.
Unsecured debt = the credit card.
Backed by a promise.
Everyone is panicking that $CRWV UNSECURED yield to MATURITY hit 15%
But a credit card rate spiking doesn't mean the house (or in this case the GPUs/data centers) lost value.
The secured lenders or the ones who underwrote the actual GPUs and contracts aren't selling here.
Now zoom out, because this is analogous to the entire AI market in wrapped up in a single company.
Trillions in secured, asset-backed debt are loaned against GPUs, data centers, power contracts, and signed capacity deals with hyperscalers. This money doesn't care about stock prices or investor sentiment.
It gets paid if the contracts pay. (Sounds pretty similar to $next if you ask me…)
Below that in line is unsecured debt, a bet on the companies themselves.
On top of everything is the equity, a bet on the story.
So when you see scary headlines about "AI debt," ask one question: which layer?
Yields spiking on unsecured debt and equities dropping while secured debt sits calm simply means the market is repricing the story.
The assets are fine.
The buildout keeps getting funded because the secured debt holders still believes in the collateral.
The day that changes… well the day secured lenders start questioning GPU values and contract quality, is the day the AI trade actually breaks and we should run for the hills.
Until then, volatility at the top of the stack (unsecured, equities) is just the shock absorbers doing their job.
Some notes on $CRWV's capital structure, from public filings and market data as of Oct 16:
DDTLs were ~38% of gross debt at 6/30 (~$13.6B of ~$35.6B). The rest was unsecured notes (~$10B), converts (~$6.6B) and OEM financing (~$5.1B). DDTL pricing has tightened over time, but much of that reflects the customer contracts behind each facility. DDTL 5.5 also priced wider than initial talk in August.
The unsecured notes trade in the low-to-mid 80s, yielding roughly 14–15%. Spreads on the 2032s have roughly doubled since June. Equity is still worth about $34B, so credit and equity are currently pricing the company quite differently.
The converts are 35–45% out of the money. A rough model puts their implied vol around 60–64%, versus ~72–75% on the longest listed options. Maturity differences and model choice could explain some or all of that gap.
The unsecured notes trade in the low-to-mid 80s, yielding roughly 14–15%. Spreads on the 2032s have roughly doubled since June. Equity is still worth about $34B, so credit and equity are currently pricing the company quite differently.
The unsecured notes trade in the low-to-mid 80s, yielding roughly 14–15%. Spreads on the 2032s have roughly doubled since June. Equity is still worth about $34B, so credit and equity are currently pricing the company quite differently.
The converts are 35–45% out of the money. A rough model puts their implied vol around 60–64%, versus ~72–75% on the longest listed options. Maturity differences and model choice could explain some or all of that gap.
If the gap holds up under a proper credit-adjusted model, one way to express it would be long the converts, short stock against them, and short senior notes as a credit hedge. The notes and converts rank equally, so they should recover the same in a default. The main risks are sizing the hedges correctly, borrow availability, and a sharp move in either direction.
The market implies roughly 15% odds of default within a year and 55–60% over 5 years, based on the senior note spreads.
The implied vols that match today's prices are about 60% for the 2031, 64% for the 2032 and 60% for the 2033, in line with my earlier estimates.
Not meant to be investment advice, just find it an interesting idea

One of the more interesting developments I’m seeing in how AI is being applied to investing is the emergence of the “one brain” concept. Essentially, building a system that can ingest and retain everything that goes into an investment process, from scribbled notes and Excel models to expert calls, management meetings, alt data, consensus revisions, macro developments and your own historical observations.
What interests me is less the ability to retrieve or summarise this information, but the possibility of continuously building and updating the mosaic. Every new datapoint should be assessed against the existing thesis, prior assumptions and what is already priced in. Is it genuinely new information? Does it change the earnings trajectory, the distribution of outcomes or the risk/reward? Does it reinforce an existing view or challenge it?
In theory, you could get to a point where the system maintains a live investment view, including a confidence level based on the underlying evidence, its reliability and how independent the various signals actually are. Importantly, you’d also have a record of how that conviction evolved, which datapoints were responsible and where your original underwriting proved right or wrong.
Given the complexity and sheer variety of inputs involved, I'm increasingly thinking the right architecture for something like this is some form of data lake/lakehouse, with Python sitting across it as the analytical and orchestration layer. Ideally, you'd have one persistent research environment that can accommodate structured financial data, unstructured notes, historical model versions and a record of how your investment assumptions have evolved. You could then have different AI models interrogating the same underlying research base rather than constantly rebuilding context from scratch. The real challenge, I suspect, will be less about warehousing the information and more about maintaining the relationships between the evidence, the underlying assumptions and the eventual investment decision.
I think there’s a lot of value in this, particularly given how fragmented most investment research processes still are. So much information gets lost in notebooks, old models, meeting notes or simply forgotten over time. Equally, we’re all susceptible to selectively remembering the evidence that supports our existing thesis.
I’m not particularly interested in AI telling me what stock to buy. I’m much more interested in whether it can help build a more complete, consistent and self-critical investment process, where accumulated knowledge actually compounds rather than repeatedly starting from scratch.
@JaredKubin @FundamentEdge curious how you both think about the architecture for something like this? Does a lakehouse/Python approach make sense, or do you see a better way of building a persistent investment memory that can actually feed into the decision-making process?
I’ve been thinking about where AI actually becomes useful in the investment process, and I think there’s a distinction between automating work and genuinely improving the quality of research.
A lot of the obvious applications are fairly straightforward. Pre-quarter summaries, earnings analysis, model updates, maintaining databooks, tracking consensus revisions. All things that should increasingly happen in the background. They save time, but I’m not convinced they represent much of a lasting advantage when everyone will eventually have access to similar tools.
Where I think it gets more interesting is having a system that retains context and continuously revisits your assumptions as new information comes in.
Take the setup into earnings. Ideally, the model should already know your original thesis, previous notes, management guidance, historical base rates, how consensus has evolved throughout the quarter and what the underlying growth trajectory looks like.
On earnings day, I’d want the system to tell me what has actually changed relative to those prior expectations, rather than simply summarising the release. What surprised us? Which assumptions were wrong? Does the new information change the forward earnings trajectory or the original investment thesis?
I think you can take this considerably further with historical data.
Every time a new data point enters a databook, the system should be able to recalculate the relevant historical relationships and tell you whether anything meaningful has changed. How unusual is the observation relative to history? Is it outside the normal seasonal range? Has its correlation with revenue or another operating KPI changed? Does it strengthen or weaken an existing leading indicator?
You could build a fairly interesting library of company-specific relationships this way, continuously updating as new information becomes available.
The more differentiated opportunity, though, is probably outside the standard quarterly workflow altogether.
I think there’s a lot of potential in building highly specialised research agents around individual companies or subsectors, particularly where the relevant data is fragmented, difficult to structure or not readily available through conventional financial data providers.
For example, combining supply-chain information, industry capacity, inventory, pricing, customer behaviour and competitor disclosures to understand a business at a more granular level. Or identifying which alternative datasets have historically been useful in anticipating changes in the underlying fundamentals, and continuously testing whether those relationships still hold.
A good analyst might have a handful of these relationships in their head, developed through years of covering an industry. The interesting possibility is being able to codify that knowledge, test it much more systematically and apply it across a far larger set of observations than would be practical manually.
There’s also a feedback loop that I think is underappreciated. The system should be able to look back at your historical assumptions and identify where you consistently got things right or wrong, which signals were useful and which relationships stopped working.
None of this removes the need to understand the businesses. In fact, the quality of the questions you ask and the economic intuition behind them probably become more important.
My sense is that most of the shorter-term earnings and modelling workflow will eventually be commoditised. That’s fine, and we should automate as much of it as possible.
But I’d be much more interested in using the time saved to build specialised systems that help answer difficult fundamental questions, continuously challenge existing assumptions and make deeper research possible at a scale that previously wasn’t economical.
That’s where I suspect the more durable value will be.