



More of the world's silver now comes out of copper mines than out of silver mines.
Copper operations supplied 28% of mined silver last year, per the Silver Institute's 2026 survey. Primary silver mines supplied 26%, a new low.
So copper supply news is silver supply news. Freeport, one of the world's largest publicly traded copper producers, reported this morning that it produced 832 million pounds of copper in Q3, down from 912 million a year earlier. It ties the drop to lower operating rates at Grasberg in Indonesia while the underground mine ramps up.
Nearly three quarters of mined silver is a byproduct. Its supply follows copper, lead, zinc and gold decisions, and a higher silver price can't call much new metal out of the ground on its own.
The AI trade is a metals trade most people still file under tech.
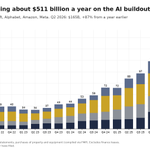
Microsoft, Alphabet, Amazon and Meta spent $165 billion on capex in Q2, up 87% in a year, per their filings. Those data centers run on copper, silver and power, and the build plans don't wait on the Fed.

No recession. No pandemic. Washington still ran its third-biggest deficit since 2000.
Treasury's final tally for fiscal 2026 came in close to $2 trillion. Only 2020 and 2021 were worse, and both of those had an emergency behind them.
All of that gets financed with new Treasuries. Three big note auctions land this week with yields already this high, and at these rates the interest bill keeps climbing, which means more borrowing after that.
Gold hasn't been trading on deficits lately. It's been trading on the Fed. But a gap this size in a non-crisis year is the slow, steady reason people hold metal, and it'll still be there after Wednesday.

Gold opened the week sitting right on $4,000, and every major average on the chart is above it.
COMEX gold closed Friday at its lowest level since mid-July, and the Sunday evening open hasn't changed much. It's been under its 50-day average since late September and under its 200-day since late August, and the 50-day has started to turn down.
That round number has held on every close since then. Wednesday's Fed decision and Thursday's PCE inflation report are the two days most likely to move it off that line.

This is a picture of where gold is, not a call on where it goes. Averages sitting above the price just mean most of the last few months traded higher than today.
Silver is in the same spot, below both of its averages, so it isn't only a gold story.
The input I'd watch closest this week is real yields. The Fed and PCE both feed straight into them.
Do you think the defensive line coach once, just once talked to the ends about maintaining contain?
Apparently NOT!!
#BYUvsUCF
40 Trillion in debt. What can or should we do now
youtu.be/7yBTsmE-Mcg?is=60sM…
Gold is up 119% since the end of 2021, and the dollar is stronger now than it was back then.
The Fed's broad dollar index did come off its early 2025 high, but it's still above its 2021 close and about where it was a year ago. Gold didn't need a weak dollar to more than double.
So if you hold gold or silver, a firm dollar week isn't the thing to lose sleep over. It hasn't been for almost five years.

The dollar was never the whole gold story, and this chart shows it.
Since 2022 gold has climbed through a dollar that stayed firm. The steadier support has come from elsewhere, like central banks adding to reserves and Washington borrowing at much higher rates.
Next week puts that to the test, with the Fed on Wednesday and the ECB and Bank of Japan on Thursday. A big dollar move off those would show up on this chart fast.
China's stack of U.S. Treasuries is down to $591 billion, the smallest since 2008.
That's 55% off the 2013 peak, and China has slipped to third behind Japan and the U.K., per Treasury's own TIC data through August.
Since the end of 2019, IMF reserve data show China adding about 438 tonnes of gold. A reserve manager that wants assets nobody can freeze or print is voting with its balance sheet.
It won't stop a week like this one for gold and silver. It does tell you where one of the world's biggest reserve holders would rather keep its savings.


What happened: The White House says no U.S. strikes on Iran before the Nov 3 midterms. NYT, FT and ABC report U.S. and Israeli plans for strikes after that.
What it means:
On Sep 15 this was a hunch of mine. Now the timing is in the reporting, and oil is trading it.
Higher oil feeds inflation, and inflation keeps the Fed leaning toward another hike. Reuters and WSJ tied this week's metals drop to that, alongside a broad stock sell-off.
When the war headlines got louder Thursday, silver fell to its lowest price this year.
Since my Sep 15 post, Brent is up about 6%, gold is down about 6% and silver is down more than 15%.
For holders, the safe-haven case is still there. My read is it kicks in when growth fears overtake inflation fears, and we aren't there yet.
Next markers: the Fed on Oct 28 and the midterms on Nov 3.


France's 10-year borrowing cost moved above America's today, with French yields rising while U.S. and German yields fell.
That is about France, not a global bond selloff. Investors are demanding more extra yield to lend to Paris, and the gap over German debt has widened to levels last seen in the euro zone debt crisis.
The lesson is that a rich country's bonds can stop behaving like a safe asset once the debt load looks hard to carry. Lenders start charging for the risk of trouble repaying, not just for inflation.
For gold and silver holders, that is the long-run reason to own metal. Gold fell with today's broader selloff, but it is no government's promise to pay, which is why central banks keep it in their reserves.
5% yields are freezing housing. That pain eventually forces rates lower, and that is gold's tailwind.
BREAKING: US housing starts fell -5.2% MoM in September, to an annualized rate of 1.22 million, the 2nd-lowest reading since May 2020.
This follows MoM declines of -4.9% and -5.9% in July and August.
Single-family housing starts dropped -4.6% MoM last month, to 859,000, the 2nd-lowest since April 2023.
At the same time, multifamily housing starts fell -7.2%, to 349,000, the 2nd-lowest since May 2025.
Higher mortgage rates and worsening affordability are heavily weighing on housing demand.
Furthermore, elevated housing inventories and falling homebuilder confidence are discouraging new construction.
The US housing market is frozen.

Housing starts fell again in September, with single-family building down as well, per the Census Bureau.
The cause is long-term interest rates. With the 10-year above 5%, mortgage rates keep buyers out, and builders stop breaking ground on homes they cannot sell.
Fewer starts means fewer construction jobs and less spending down the line. That is how high rates slow the real economy, and a slowing economy is what eventually pulls yields back down.
For gold and silver holders, lower yields cut the cost of owning metal that pays no interest. One report will not turn yields around by itself, but it adds to the pressure against rates this high.
Silver Alert: Your Loss Is 19% But This Isn't What You Think. youtu.be/vTKV8QvIqRg?is=Qdra… via @YouTube
Housing just showed you the rate damage.

NAHB builder sentiment fell to a 14-year low in October as mortgage rates climbed with Treasury yields.
High long rates show up as buyers who cannot clear today's prices. Builders are cutting prices and watching traffic dry up.
That same yield move has been the main headwind for gold and silver. Soft housing is the real-economy side of the rate story.
For metal holders, do not treat a soft housing print as a buy signal by itself. Watch whether weaker demand eventually pulls the 10-year down. Until that happens, the rate pressure on metals stays intact.