

Adventures in data visualization, ocean science, and how we learn from a web dev/oceanographer/UX wonk in NJ.
New Brunswick, NJ
Joined January 2012
- Tweets837
- Following327
- Followers238
- Likes160



My simple solution to improve both democracy and AI... join Scouting and follow the Scout Oath and Scout Law in everything you do and every answer you provide.
52
Really enjoyed my first real oceanographic cruise, collecting data and teaching others about the OOI and @ooidatalab. Thanks @oceanobserv for the invite, and to the awesome crew of the @rv_neil for running a great ship. When do we sail again?

8 days aboard the @rv_neil, provided an experiential and immersive experience for @STEMSEAS and @TheHBCUSTEMulUS participants, who were encouraged to take back and use OOI data in their classrooms. https://teapaw.org/t.co/eArOQ6PALo. @NSF, #nsffunded, @visualocean

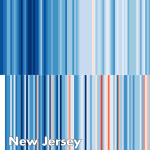
Shhh... Silly NOAA, we're not supposed to tell folks how good the climate is (for now) in Clinton. But it is in New Jersey, so perhaps no-one will believe it. @NJClimate @NJGov

Finding concise climate information about your state just got easier with the release of the new State Climate Summaries by @NOAA and partners: https://teapaw.org/t.co/wI9EbFrCm8 @NCState_NCICS @USGCRP @StateClimate #ScienceNews #StateSummaries2022

Proud to be part of designing this new informal science #oceanography kit for 4-H! It includes a mini glider (aka ocean robot) you can ballast yourself. Check it out and order one today! @RutgersDMCS @ooidatalab @4hrutgerssci
This Post is from an account that no longer exists. Learn more
4
Happy to get a chance to demo our new online tools to help researchers and Broader Impact professionals develop and evaluate their plans. Getting the UX right (or at least usable ;) has been a fun challenge.
This Post is from an account that no longer exists. Learn more
And here's my second OCEANS 2021 paper… Engaging students in an ocean data analysis based Virtual REU
ieeexplore.ieee.org/document…
1
The OCEANS 2021 papers are out! Here’s my first one… A design process for developing Ocean Data Explorations
ieeexplore.ieee.org/document…
1
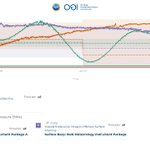
A quick look at the #HungaTonga #volcano eruption's impact on atmospheric pressure (green) and seafloor pressure (orange) data as measured at the OOI Endurance Array Oregon Offshore site, 8,843km away. @oceanobserv @ooidatalab #oceanography #oceanscience #waves 1/6

Based on this article, could the atm wave seen at Pioneer actually be reflection from the #HungaTonga Antipode?
Est. speed from HT to CE: 1,123 km/hr
Distance from HT to Antipode to CP: 27,336 km
Est. arrival time 4:34ish, compared to 4:41 from data.
eos.org/articles/the-surpris…
1
Omg apparently it’s been 10 years and I still haven’t learned how to tweet well. Thanks twitter for the reminder. #MyTwitterAnniversary #notGreatUX

A bit late for Halloween... but if your boss is one of these horror show monsters, you might want to flee now. Or call the leadership ghostbusters at @BLichtenwalner
modernservantleader.com/serv…