

See what the score didn't. xG, xA and xT for every Premier League player, per 90 and ranked by percentile. A full report for every match.
- Tweets1.8K
- Following644
- Followers4.1K
- Likes1.1K
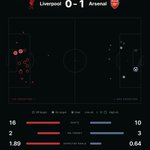




ALT Shot map for Liverpool 0-1 Arsenal. Expected goals 1.89 to 0.64 from 16 and 10 shots. Each side's shots are drawn in its own colour: hollow off target, solid on target, a football for a goal. Marker size is shot xG. Best chance: K. Havertz, 15 minutes, 0.35 xG, goal.

ALT Cumulative expected goals race chart for Liverpool 0-1 Arsenal. Final xG: 1.89 to 0.64. Footballs mark goals, labelled with the scorer.

ALT Shot-by-shot table for Liverpool 0-1 Arsenal, every player who had a shot, ordered by total expected goals. K. Havertz led with 1 shot worth 0.35 xG.

ALT Passing networks for Liverpool 0-1 Arsenal. Liverpool completed 385 passes, Arsenal 275. Each node sits at a player's average position, sized by how many passes they played or received, and each line's weight is how much those two players passed to each other. The shaded band is where each side's final-third passes went by channel. Liverpool's strongest combination was Dijk and Nyoni, 20 passes between them. Arsenal's strongest combination was Rice and Madueke, 12 passes between them.



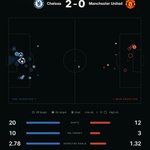
ALT Shot map for Chelsea 2-0 Manchester United. Expected goals 2.78 to 1.32 from 20 and 12 shots. Each side's shots are drawn in its own colour: hollow off target, solid on target, a football for a goal. Marker size is shot xG. Best chance: C. Palmer, 63 minutes, 0.76 xG, goal.

ALT Cumulative expected goals race chart for Chelsea 2-0 Manchester United. Final xG: 2.78 to 1.32. Footballs mark goals, labelled with the scorer.

ALT Shot-by-shot table for Chelsea 2-0 Manchester United, every player who had a shot, ordered by total expected goals. C. Palmer led with 4 shots worth 0.98 xG.

ALT Passing networks for Chelsea 2-0 Manchester United. Chelsea completed 474 passes, Manchester United 313. Each node sits at a player's average position, sized by how many passes they played or received, and each line's weight is how much those two players passed to each other. The shaded band is where each side's final-third passes went by channel. Chelsea's strongest combination was Fofana and Colwill, 30 passes between them. Manchester United's strongest combination was Fernandes and Cunha, 13 passes between them.
ALT Shot map for Chelsea 2-0 Manchester United. Expected goals 2.78 to 1.32 from 20 and 12 shots. Each side's shots are drawn in its own colour: hollow off target, solid on target, a football for a goal. Marker size is shot xG. Best chance: C. Palmer, 63 minutes, 0.76 xG, goal.
ALT Cumulative expected goals race chart for Chelsea 2-0 Manchester United. Final xG: 2.78 to 1.32. Footballs mark goals, labelled with the scorer.
ALT Shot-by-shot table for Chelsea 2-0 Manchester United, every player who had a shot, ordered by total expected goals. C. Palmer led with 4 shots worth 0.98 xG.
ALT Passing networks for Chelsea 2-0 Manchester United. Chelsea completed 474 passes, Manchester United 313. Each node sits at a player's average position, sized by how many passes they played or received, and each line's weight is how much those two players passed to each other. The shaded band is where each side's final-third passes went by channel. Chelsea's strongest combination was Fofana and Colwill, 30 passes between them. Manchester United's strongest combination was Fernandes and Cunha, 13 passes between them.


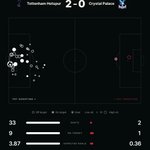
ALT Shot map for Tottenham Hotspur 2-0 Crystal Palace. Expected goals 3.87 to 0.36 from 33 and 2 shots. Each side's shots are drawn in its own colour: hollow off target, solid on target, a football for a goal. Marker size is shot xG. Best chance: J. van Hecke, 72 minutes, 0.57 xG, goal.

ALT Cumulative expected goals race chart for Tottenham Hotspur 2-0 Crystal Palace. Final xG: 3.87 to 0.36. Footballs mark goals, labelled with the scorer.

ALT Shot-by-shot table for Tottenham Hotspur 2-0 Crystal Palace, every player who had a shot, ordered by total expected goals. J. van Hecke led with 5 shots worth 1.29 xG.

ALT Passing networks for Tottenham Hotspur 2-0 Crystal Palace. Tottenham Hotspur completed 747 passes, Crystal Palace 154. Each node sits at a player's average position, sized by how many passes they played or received, and each line's weight is how much those two players passed to each other. The shaded band is where each side's final-third passes went by channel. Tottenham Hotspur's strongest combination was Hecke and Ven, 79 passes between them. Crystal Palace's strongest combination was Kamada and Canvot, 12 passes between them.


ALT Shot map for Manchester City 0-1 Brighton. Expected goals 2.48 to 1.15 from 20 and 7 shots. Each side's shots are drawn in its own colour: hollow off target, solid on target, a football for a goal. Marker size is shot xG. Best chance: Y. Ayari, 10 minutes, 0.55 xG, goal.

ALT Cumulative expected goals race chart for Manchester City 0-1 Brighton. Final xG: 2.48 to 1.15. Footballs mark goals, labelled with the scorer.

ALT Shot-by-shot table for Manchester City 0-1 Brighton, every player who had a shot, ordered by total expected goals. Y. Ayari led with 1 shot worth 0.55 xG.

ALT Passing networks for Manchester City 0-1 Brighton. Manchester City completed 506 passes, Brighton 294. Each node sits at a player's average position, sized by how many passes they played or received, and each line's weight is how much those two players passed to each other. The shaded band is where each side's final-third passes went by channel. Manchester City's strongest combination was Khusanov and Dias, 43 passes between them. Brighton's strongest combination was Verbruggen and Dunk, 21 passes between them.


ALT Scatter chart answering "Who creates the chances?" for the Premier League 2026/27: Key Passes against xA for 160 players, with P. Foden highlighted at 2.24 against 0.49.