

$100 → $40,000 → $0 → $1,000,000 believe in yourself.
Joined January 2024
- Tweets9.7K
- Following90
- Followers25.3K
- Likes9.9K




Hopper retweeted
🚨 EVERY BITCOIN BEAR MARKET BOTTOMED ABOUT A YEAR AFTER THE TOP
2013: 410 days, −87%
2017: 363 days, −84%
2021: 376 days, −78%
2025: day 407 today, −51% so far
Every single cycle bottomed between day 363 and day 410
Day 410 is this Friday. We printed $61K on day 405
History repeats. The bottom is around 58k-62k
A year after each bottom $BTC was up 128% to 182%. From $61.9K thats $141K-$175K by November 2027
Just survive

I SOLD 5 $BTC AT $65.0K
The week closed under $67K.
I said Id sell if it did, so I did
Taking a $39K loss on those 5.
I still hold the other 5.
My buy orders now sit at $58K–$60K.
Hopper retweeted
Hey @grok,
I still hold 5 $BTC and have buy orders at $58K–$60K
Is that the next cycle bottom before a new ATH, or am I buying too early?
I SOLD 5 $BTC AT $65.0K
The week closed under $67K.
I said Id sell if it did, so I did
Taking a $39K loss on those 5.
I still hold the other 5.
My buy orders now sit at $58K–$60K.
Hopper retweeted
🚨 I’M POSITIONING FOR $200K BITCOIN
I bought at $75.9K
Added at $67.9K
10 BTC with an average entry of $72.7K
My target for the next cycle is a new ATH near $200K in 2029
But this chart leaves room for another leg down before the recovery
My near-term plan is already public
Weekly close below $67K → sell 5 BTC
$58K–$60K → look to buy them back
$85K and $93K remain my rebound targets
A bounce there wouldn’t prove the whole correction is over
The next few months are about building the position for the next cycle
There may be better entries along the way
I want cash ready if we get them
THE OTHER HALF OF THE PLAN IS KNOWING WHEN TO SELL
If Bitcoin approaches $200K in 2029, I’ll be looking to take profits before the next bear market
The chart puts that next reset in 2030
I don’t want to spend years building a position and then give the gains back because I got greedy
I’ve posted the entries
I’ll post the cuts and new buys too
Save the chart and follow the trade from entry to exit
Hopper retweeted
$ETH lost the $2,600 level from my October update
Now I’m watching $1,800 for a reversal
The previous rally highlighted here was +127%
I’m watching for another big bounce
have so many friends hesitate to buy $ETH
all waiting to see break above $2,800
but hear me out:
- highest weekly close since january
- +73% from the june low at $1,566
- back above the 20, 50, 100 and 200 day MAs
- 3 green months in a row
- ETH/BTC +23% from its june low
price +10% in 30 days
OI on binance flat at ~2.29M ETH
funding basically 0
price up, OI flat = spot buyers, not leverage
bitmine keeps buying every single week, now 6.02M $ETH
and 1.5M ETH is waiting in the staking entry queue
my levels:
$2,600 has to hold
daily close above $2,800 and $3k is the magnet, $3,400 after that
i'd rather be wrong than skip the trade of the cycle

Hopper retweeted
$BTC JUST CLOSED BELOW THE 200 WEEK MOVING AVERAGE FOR THE 4TH TIME
The first 3 times:
June 22: +6.9% the next week
July 27: +2.1%
Aug 10: +23.7%
None of them went more than 3% lower after the close.
60 days later every one was up 31–35%
Every dip under this line got bought within a week. It's the floor
Bitcoin can be back above $68K before December and near $85K by mid-January
I SOLD 5 $BTC AT $65.0K
The week closed under $67K.
I said Id sell if it did, so I did
Taking a $39K loss on those 5.
I still hold the other 5.
My buy orders now sit at $58K–$60K.
Hopper retweeted
I SOLD 5 $BTC AT $65.0K
The week closed under $67K.
I said Id sell if it did, so I did
Taking a $39K loss on those 5.
I still hold the other 5.
My buy orders now sit at $58K–$60K.
Hopper retweeted
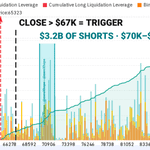
🚨 A $3B $BTC SHORT SQUEEZE IS LOADING
$3.2B of shorts sit between $70K and $71.6K
A daily close back above $67K is the trigger.
After that those shorts become fuel

🚨 $BTC DID THIS IN 2023 TOO
Big rally. Ugly pullback. Then another leg up
2026 is looking familiar
My bet this drop shakes people out before the next move higher
Hopper retweeted
I BOUGHT 4 MORE BTC AT $67.9K
$BTC hit $67,500 overnight. Order filled.
I have 10 BTC now
Average entry: $72.7K
The plan hasn't changed.
Next target: $85K
Break that and I'm looking at $93K
If the week closes below $67K, I sell half and rebuy at $58K–$60K
Hopper retweeted

🚨 BITCOIN AND NVIDIA TOPPED ON THE SAME DAY. ALMOST AS IF IT WAS COORDINATED
Oct 6, 2025: $BTC tops.
Oct 6, 2026: $NVDA tops.
BTC lost 30% in ~40 days.
NVDA lost 30%i n ~40 days too
Bitcoin bounced 20% next, then made new lows
That's not a coincidence...

On December 12, 2023, a mysterious 4chan user claimed Bitcoin would top exactly on October 6, 2025.
Nearly 650 days from his prediction, BTC did indeed peak that exact day at $126,198.27.
Based on the pattern he described, where ATHs vary between 1064 and 364 days per cycle, the next all-time high would be on September 5, 2027.
Bookmark this post and let’s see if the simulation is real and it comes true.

Hopper retweeted
🚨 DON'T SELL YOUR BITCOIN INTO THIS DIP
Panic sell pushed $BTC down to $71k. But the whole picture never changed
I'm keeping my 6 BTC from $75.9K and adding at $67.9K
Only if $BTC closes a week below $67K. Then I sell half and rebuy at $58K–$60K
Hopper retweeted
🚨 $BTC
I put 2022 next to 2026, and the setups look almost identical
- Range high reclaimed
- Retest happening now
- Support holding
- Everyone bearish
I’m looking for another push higher
This pullback hasn’t changed my view, and I’m definitely not shorting this setup
I’ll keep you updated
Hopper retweeted
Options are far superior to futures. Always have been.
Take a look at @clickoptions_ai's approach. On the surface it looks pretty much like a futures contract, but it's Futures without liquidation.
Only the expiration date decides whether you're right or not, no matter what happens in between.
You can be 100x long on $BTC, the price can swing 10–20% back and forth, and you still win in the end.

Been looking at @clickoptions_ai's Futures without liquidation now that they've launched, and the idea looks very interesting. Each contract is a deep in-the-money option with a fixed expiry, so it moves almost one for one with price and there's no liquidation price.
You see the fee (0.01% per side) and the full funding to expiry before you open. On BTC yesterday it was 29x for tomorrow and 14x for 11 days out.
At 29x a perp gets liquidated by a 3.45% move and you're out for good. With options, that move hurts just as much on paper, but you're still in the trade if price comes back before expiry. 1 in 5 liquidated 29x BTC longs were in profit 3 days later.
The catch is that every contract expires, so staying in longer means new funding, and leverage drops on longer dates. You can still lose money if price goes against you and stays there.
Hopper retweeted
🚨 CALIFORNIA JUST VOTED TO BRING BACK 2008 HOUSING CRISIS
Something wild just happened, and most people are just ignoring it
Over 61% of California voters just passed Prop 37
Buyers of newly built homes can now put down only3%
The state lends them the other 17% as a second mortgage.
Funded by up to $25 billion in bonds.
Sound familiar?
In 2006, almost 24% of conventional home purchase loans came with a second "piggyback" loan.
It covered up to 20% of the price.
And in November 2006, California voters passed Prop 1C.
$625 million for down payment help.
Here's the part that should terrifies me the most:
From November 2006 to May 2009:
Los Angeles: -41.22%
San Francisco: -43.80%
San Diego: -39.78%
Today, prices there are 63.6% to 77.5% ABOVE the 2006 peak.
And this time the program is 40x bigger.
Nobody gives a f*ck about middle class.
Just follow the money on this one and you will understand how the world works.
Who wrote it?
Former Assembly Speaker Bob Hertzberg.
He worked on it for years, together with the California Association of Realtors.
Then the Realtors put $16.1 million behind it.
The biggest money in the campaign.
Realtors get paid when homes sell.
And only NEW homes qualify, so the builders get paid too.
Builders who sign up even get an easier process for defect lawsuits.
$25 billion at up to 17% per loan = at least $147 billion of new home sales.
Not a single argument against it was submitted .
Yes, these are fixed-rate loans, not 2006 teaser rates.
But with 3% down, a 3% price drop wipes out the buyer's equity.
I've seen this movie before.
In 2008-2010, the same agency, CalHFA, lost $335 million.
Its own auditor blamed mortgage products "that were easier for borrowers to qualify for."
Its mortgage insurance fund was headed for insolvency
The same line back then: "the State is not liable."
And it won't stop with the buyers.
Everyday Americans will pay for this.
How do I know? Britain already ran this exact experiment.
Prop 37: 3% down. A state loan up to 17%. New homes only.
UK Help to Buy: 5% down. A government loan up to 20%. New homes only.
Same concept. And it ran for 10 years, from 2013 to 2023.
London even looks like California: no land, little new supply, already unaffordable.
Here's what happened there:
Prices rose by MORE than the help was worth.
No measurable rise in building.
The developers made more money.
So the "help" ended up in higher prices.
And higher prices hit every buyer, not just the ones who got the loan.
And housing is already 35.6% of the CPI the Fed is fighting.
Pump borrowed money into it and "higher for longer" stays.
For anyone with a mortgage, a car loan or a credit card.
What could possibly go wrong?
Screenshot this. Come back when everyone starts calling it "obvious."
If you own a home or plan to buy one, follow me today.
Or you'll wish you had when the next housing crash hits.
When I see the first crack in the data, I'll post it here first
Hopper retweeted
🚨 HEAR ME OUT
The market is setting up the biggest crisis in history.
Everyone is afraid of another 2008.
THEY ARE WRONG.
This could get MUCH worse.
Look at what just happened:
Chip stocks fell 12.25% in one session. The 2nd worst day in their history.
-35.84% since June.
Taiwan just had its worst week since 2001.
-16.38% since October.
Now it's restricting short selling.
Korea's KOSPI: -44.94% since June.
And the S&P 500? It's only 5.65% off its all-time high.
It still hasn't seen the kind of panic selling that creates a true bottom.
Even if this is only as bad as the Dot-Com crash, the next stops:
- Chips: 2,350.59 (-74.97%)
- Taiwan: 16,829.85 (-59.60%)
- Korea: 4,034.35 (-19.62%)
- S&P 500: 3,976.16 (-46.10%)
In the Dot-Com crash, it took 20 to 31 months to get there.
And the setup underneath is bigger than 2008.
Foreign investors made a record $942 bn in net purchases of US equities in the 12 months to July.
Higher than 2007 or 2021. The highest in Treasury data going back to 1985.
The entire world wants US stocks.
Margin debt: $1.48 trillion.
As a % of GDP, a record 4.5%. Higher than the Dot-Com Bubble. Higher than 2021.
Global debt: a record $365.5 trillion.
And the Fed? It's hiking into this.
Rate hike odds for December: 78%.
The IMF already warned: a steep drop in AI investment could lead to a sharp fall in asset prices.
Any one of these snapping would be enough to shake the world.
All of them at once?
Everything falls apart.
I warned you back on October 23 that the AI crash had started in Korea.
Since then:
KOSPI: -9.58%
Chip stocks: -12.50%
Most people will ignore this, a few will listen.
History usually rewards the few.
When the real bottom hits, I'll say it here publicly.
If you want to survive what's coming, follow and turn on notifications.
Hopper retweeted
🚨 GOLD HAS TRAPPED BUYERS THREE TIMES. NOW IT’S TESTING $4,000
$5,400 → $4,750 → $4,700
Three failed rallies. Each high lower than the last
But the selloff has now reached the first buying zone on my chart
My scenarios for $XAU:
2 total Fed hikes → a base around $4,000
3+ hikes → a deeper correction toward $3,500
If $3,900–$4,050 holds, I’m watching for a recovery toward $4,600
If it breaks, $3,500–$3,650 becomes the next zone to watch before a potential recovery toward $4,800
These are scenarios. I still want to see buyers defend support
I’d rather miss the first bounce than buy the fourth bull trap
Hopper retweeted
🚨 The US Treasury will buy back up to $70 billion of old bonds in just 3 months.
This is the biggest liquidity buyback in US history.
More than the entire 2000–2002 buyback program ($67.51 billion).
Plus $25 billion of short bills. $95 billion in total.
The headlines call it "liquidity support."
The most dangerous number in finance this year is 5.31%.
That's the US 10-year yield on October 5th. Highest since 2002.
For 24 years it never got there.
This one number sets YOUR mortgage, YOUR stock valuations, YOUR government's interest bill.
August 19th: the Treasury doubled its long-bond buybacks to steady the bond market.
The buybacks didn't stop the bond selloff.
The 10-year kept climbing for 7 more weeks, all the way to 5.31%.
The 30-year hit 5.67%, highest since 2001.
November 4th: they nearly doubled the liquidity buybacks again.
$38 billion → $70 billion a quarter.
I read the Treasury's own presentation. Page 15 admits it:
"buybacks are not expected to significantly affect privately-held net marketable borrowing as new issuance replaces securities that are bought back."
In other words: they borrow with new bills to buy back old bonds.
$332 billion of new bills this quarter.
The last time the 10-year was this high, in 2000–2002, the Treasury was buying back its debt too.
Back then it paid with budget surpluses. Debt held by the public fell $303 billion.
Now it's up $2.49 trillion in 13 months.
You can't shrink a debt by borrowing to buy it back. You can only make it shorter.
I'm watching the 10-year VERY closely.
When it closes back above 5.31%, I will post the warning before the headlines catch up.
Follow so you don't miss it.
Hopper retweeted
🚨 S&P 500 DRAWDOWN AFTER EVERY RECENT MIDTERM ELECTION:
1962: -12.3%
1966: -18.2%
1970: -7.1%
1974: -28.6%
1978: -9.3%
1982: -27.1%
1986: -8.4%
1990: -18.2%
1994: -9.3%
1998: -18.3%
2002: -21.1%
2006: -6.9%
2010: -16.0%
2014: -11.2%
2018: -21.2%
2022: -4.9%
NOT A SINGLE POSITIVE RETURN IN 60 YEARS
2026 WON'T BE DIFFERENT
This is exactly what I told you would happen.
S&P 500 was at all-time highs, but the real macro support showed real weakness.
17 out of 17 midterm years proved one thing:
Every pump before the 200 EMA touch ended the same way.
Dump.
Remember, I’ve been trading markets for over 15 years.
Turn notifications on.
If you’re not following yet, you’ll understand why that was a mistake later.