

Decoding Mutual Funds with Data 📊 Tracking portfolios of India’s top AMCs. Trader⚡ | Investor. • Fresh buys • Portfolio moves • Fund journeys #FinAlpha1Pager
India
Joined December 2020
- Tweets12.4K
- Following2K
- Followers12.1K
- Likes134K







Pinned Tweet
A compilation of all the SIP comparison 1Pagers for different categories. I will keep posting this once every 6 months.
Did i miss any category ?
#FinAlpha1Pager #MutualFunds
1. Flexicap Funds :
teapaw.org/AnkitFinAlpha/status/2…
2. Multicap Funds :
teapaw.org/AnkitFinAlpha/status/2…
3. Midcap Funds :
teapaw.org/AnkitFinAlpha/status/2…
4. MultiAsset Funds :
teapaw.org/AnkitFinAlpha/status/2…
5. Smallcap Funds :
teapaw.org/AnkitFinAlpha/status/2…
6. Focused Funds :
teapaw.org/AnkitFinAlpha/status/2…
7. ELSS Funds :
teapaw.org/AnkitFinAlpha/status/2…
8. Large & Midcap Funds :
teapaw.org/AnkitFinAlpha/status/2…
9. Largecap Funds :
teapaw.org/AnkitFinAlpha/status/2…

Highly requested one, here is a comparison of #MultiCap funds SIP across identical time horizons, all measured up to May 15, 2026 : #FinAlpha1Pager
Quick Highlights:
🔹 Short-term:
With the Nifty 500 Multicap TRI at -0.54% for 1Y, some active funds have done well.
🔹 Mid to Long-term: True compounding shines. While the 3Y benchmark sits at 7.23%, the structural allocation to mid and small caps helps top-performing funds deliver a massive 16% to 20%+ XIRR over the 7Y and 10Y horizons.
The strict 25% mandate across large, mid, and small caps makes active fund management critical here, leading to wide performance gaps across the category.
How is your Multi Cap SIP performing against the benchmark ?
Comment down below.
#MutualFunds #StockMarket #FinAlpha


Helios Flexicap vs Bajaj Finserv Flexicap 📈
Portfolio Overlap Study : FinAlpha1Pager
Two Flexicap funds launched just months apart - let's check their portfolio overlap and side-by-side analysis!
The Data: Portfolio Overlap: 15.0% (representing 28.6% of AUM). 📊
Common Holdings: 18 shared stocks. 🤝
Top Common Stocks: Shared allocations in key high-conviction picks featuring HDFC Bank (4.31% | 5.86%), ICICI Bank (4.12% | 5.49%), and Reliance Industries (1.95% | 3.94%).
Industry Overlap: 100% overlap in Commercial Services & Supplies, followed by Petroleum Products (100%) and Textiles & Apparels (50%).
Concentration: Helios Flexicap allocates 34.3% to its Top 10 holdings, compared to Bajaj Finserv Flexicap at 34.1%. 🎯

Helios Flexicap vs Abakkus Flexicap 📈
Portfolio Overlap study Sept 2026 : FinAlpha1Pager
Two fan favorite Flexicap funds from new-age AMCs side by side, each following their own distinct style of investment !
The Data:
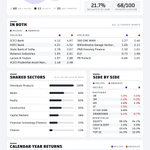
Portfolio Overlap: 10.4% (representing 21.7% of AUM). 📊
Common Holdings: 11 shared stocks. 🤝
Top Common Stocks:
Shared allocations in key high-conviction picks featuring HDFC Bank (4.31% | 4.52%), ICICI Bank (4.12% | 4.97%), and State Bank of India (2.78% | 3.67%). 🏦
Industry Overlap: 100% overlap in Petroleum Products, followed by Banks (60%) and Realty (50%).
Concentration: Helios Flexicap allocates 34.3% to its Top 10 holdings, compared to Abakkus Flexicap at 32.9%. 🎯
With such a healthy and acceptable overlap, do you hold both or prefer one style over the other ?
Comment down below !
Disclaimer : Invested

How was the month of October for Hybrid: Multi Asset Allocation Funds ? 📉
Sorted by Monthly Returns [30 Sep – 31 Oct]
A steady display of downside defense!
While broader equity markets remained soft this October, Multi Asset Allocation funds continued to cushion volatility effectively compared to pure equity categories.
Edelweiss managed to hold green territory, Quantum finished flat, and top-ranking schemes significantly limited monthly drawdowns.⚖️
(Note: Please ignore the benchmark comparison for now, as a broad equity index like NIFTY 500 is not an ideal yardstick for multi-asset strategies. A custom blended benchmark for this category is currently in development.)

How was the month of October for Equity: Focused Funds? 📈
Sorted by Monthly Returns [30 Sep – 31 Oct]
A divergent month for Focused funds!
While broader market weakness pulled the majority of schemes into the red, high-conviction positioning paid off for several top funds that finished solidly in positive territory and comfortably beat the index.
⚖️ The benchmark index, NIFTY 500 TRI, closed the month down by -0.75%.

How was the month of October for Equity: Large & Midcap Funds ? 📉
Sorted by Monthly Returns [30 Sep – 31 Oct]
A predominantly red month across the category!
October proved challenging for Large & Mid Cap funds, with Samco emerging as the solitary fund to post a positive return while the rest closed in the red.
Nevertheless, several top-ranking schemes demonstrated solid downside defense, outperforming the benchmark index.
🔴 The benchmark index, NIFTY LargeMidcap 250 TRI, closed the month down by -1.32%.

Amazing ! More power to you guys.
I lost my grandpa to cancer and remember feeling so helpless.
This gives new hope to people battling such a deadly disease.
What a time to be alive!

Trust MF Small Cap Fund 6 month journey - FinAlpha1Pager
Approaching its two-year anniversary soon, this fund has established itself as a standout top performer in the small-cap category since inception. @theMihirV
Let us take a detailed look at its latest 6-month portfolio journey! 🚀
🔹 Sector Allocation & Key Shifts:
• Pharmaceuticals & Biotech saw aggressive accumulation, jumping by ⬆️ 2.8%.
• Retailing and Industrial Products both experienced solid additions, up by ⬆️ 2.4% and ⬆️ 2.0%.
• Capital Markets faced a massive reduction, dropping heavily by 🔻 6.0%.
• Chemicals & Petrochem and Banks were also trimmed, sliding down by 🔻 2.4% and 🔻 1.6%.
🔹 Portfolio Action:
• The fund maintains an active 84% turnover.
• It recorded aggressive churn with 63 total buys and 55 complete exits, expanding the overall stock count from 68 to 72.
🔹 CAGR vs NIFTY Smallcap 250 TRI:
• ⬆️ Massive outperformance across all reported horizons, delivering an extraordinary alpha of 7.3% over 3 months, 13.6% over 6 months, and 23.1% over the 1-year period.
• Be sure to check the attached image for a detailed look at the SIP XIRR metrics!

Helios Large and Midcap Fund 6 month journey - FinAlpha1Pager
Celebrating its second anniversary @heliosMF , let us take a detailed look at the 6-month portfolio journey and key allocation shifts of the Helios Large & Midcap fund! 🎂
🔹 Sector Allocation & Key Shifts:
• Pharmaceuticals & Biotech saw noticeable accumulation, jumping by ⬆️ 1.8%.
• Finance and Banks both experienced steady additions, increasing by ⬆️ 1.1% and ⬆️ 0.9%.
• Capital Markets faced the largest reduction, dropping heavily by 🔻 2.2%.
• Electrical Equipment was also trimmed, sliding down by 🔻 1.8%.
🔹 Portfolio Action:
• The fund maintains a controlled 30% turnover.
• It recorded 20 total buys and 15 complete exits, slightly expanding the overall stock count from 57 to 59.
🔹 CAGR vs NIFTY LargeMidcap 250 TRI:
• ⬆️ Strong outperformance against the benchmark across all tracked horizons, delivering an alpha of 3.4% over 3 months, 3.9% over 6 months, and 4.4% over 1 year.
• Be sure to check the attached image for a detailed look at the SIP XIRR metrics!


How was the month of October for Equity: Multicap Funds ? 📉
Sorted by Monthly Returns [30 Sep – 31 Oct]
Another category caught in a sea of red!
October proved to be a challenging month for Multi Cap funds, with every single fund on the list finishing in negative territory.
That said, the top-performing schemes demonstrated resilient downside defense, holding up notably better than the broader benchmark.
🔴 The benchmark index, NIFTY 500 Multicap 50:25:25 TRI, closed the month down by -1.85%.

How was the month of October for Equity : Smallcap Funds ? 📈
Sorted by Monthly Returns [30 Sep – 31 Oct]
A complete sea of red across the category!
October proved to be another tough month for Small Cap funds, with every single fund on the list finishing in negative territory.
However, several top-ranking schemes demonstrated solid downside defense, cushioning losses well ahead of the broader index.
🔴 The benchmark index, NIFTY Smallcap 250 TRI, closed the month down by -5.78%.
This comprehensive list includes most funds in the category and tracks vital metrics such as current drawdown (DD%). 📊

How was the month of October for Equity: Midcap Funds ? 📈
Sorted by Monthly Returns [30 Sep – 31 Oct]
Another sea of red across the category!
October proved to be a challenging month for Mid Cap funds, with every single fund on the list finishing in negative territory.
That said, a solid number of schemes demonstrated resilient downside defense, cushioning the fall notably better than the broader index.
🔴 The benchmark index, NIFTY Midcap 150 TRI, closed the month down by -3.69%.

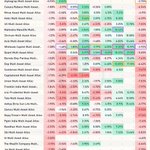
How was the month of October for Equity: Flexicap Funds ? 📉 - FinAlpha1Pager
Sorted by Monthly Returns [30 Sep – 31 Oct]
A choppy and divergent month for Flexi Cap funds this October.
While broader market weakness dragged the majority of schemes into negative territory, a select handful of funds successfully bucked the trend to finish the month in the green.
The benchmark index, NIFTY 500 TRI, closed the month down by -0.75%.
This comprehensive list includes most funds in the category and tracks vital metrics such as current drawdown (DD%). 📊

Stacked chart from Jan 2018 to Oct 2026 showing how far NSE stocks sit from their 200-day average, in bands from above it (teal) to more than 20% below (red), with NIFTY 50 overlaid.
Now 35% are above and 15% are more than 20% below form their 200-day average.

Invesco Multi Asset Portfolio Update (Sep 2026) 📊
A relentless inflow deployment month at Invesco! The team executed zero fresh entries, zero exits, and zero trims instead systematically topping up 71 out of 74 holdings across the board, led by noticeable volume additions in ONGC (+1.4L shares), ITC (+1.3L shares), Coal India (+73K shares), and HDFC Bank (+24K shares).
Asset Allocation Changes :
Equity ⬇️
International Equity ⬇️
Reits/InvITs ⏸️
Gold ⬇️
Silver ⬇️
Debt ⬆️
📈 71 Increase in Holdings
(Including: ONGC, ITC Ltd, Coal India, HDFC Bank, Tata Steel etc.)
📉 0 Decrease in Holdings
(None this month)
⏸️ 3 Companies - No Change
(Held steady across 3 holdings)
The fund remains broadly diversified across 70+ listings, maintaining a 46.6% domestic equity core heavily anchored by Banks (11.2%), supported by 11.7% in international equities and a solid 16.4% combined hedge in gold and silver.
Detailed 1-Pager attached! 📄


Hi MedX, wanted to ask you this for a long time.
Every time I order medicines online, I get a call offering substitute medicines, most of which are 50% cheaper.
I never opt for them, but does it make a difference ?
Is there any difference in efficacy ?
Attached an example.

AlphaGrep Multi Asset Portfolio Update (Sep 2026) 📊
A massive quantitative cleanout at AlphaGrep! The fund completely dumped blue-chip stalwarts like HDFC Bank, Reliance, Axis Bank, and TCS, aggressively rotating capital into REITs & InvITs alongside fresh entries like Brookfield REIT and Hyundai Motor India. Meanwhile, net metal derivatives were intentionally trimmed, with the ~10% "Others" derivative sleeve parked in copper and crude.
Asset Allocation Changes :
Equity ⬇️
Reits/InvITs ⬆️
Gold ⏸️
Silver ⬆️
Debt ⬆️
🟢 18 Fresh Buys
(Includes: Brookfield India Real Estate, Hyundai Motor India, HDFC AMC, Lupin, Uno Minda, Havells India, Coal India etc.)
🔴 21 Full Exits
(Includes: HDFC Bank ,Reliance Industries ,Axis Bank , TCS ,Bajaj Finance , Godfrey Phillips, Persistent Systems etc.)
📈 63 Increase in Holdings
(Including: Knowledge Realty Trust, Embassy Office Parks REIT, Nexus Select Trust REIT, National Aluminium, NTPC, L&T Finance etc.)
📉 8 Decrease in Holdings
(8 positions trimmed across the broader book)
⏸️ 0 Companies - No Change
(None this month — entire portfolio actively rebalanced)
The young fund stays exceptionally active across 110 listings, significantly hiking REITs/InvITs exposure to 6.3% and fixed income to 29.0%, with commodity derivatives (copper & crude) offering tactical non-equity diversification.
Detailed 1-Pager attached! 📄


quant Multi Asset Portfolio Update (Sep 2026) 📊
A sharp tactical reshuffle by quant! The fund aggressively scaled up stakes in Zydus Lifesciences (+12.4L shares) and Indus Towers (+25.1L shares), while heavily paring down DLF (-9.5L shares) and Premier Energies.
In commodities, they also executed an internal silver swap exiting third-party Nippon Silver into their own quant Silver ETF.
Asset Allocation Changes :
Equity ⬇️
Gold ⬇️
Silver ⬇️
Debt ⬇️
🟢 0 Fresh Buys
(None this month)
🔴 0 Full Exits
(None this month)
📈 2 Increase in Holdings
(Indus Towers Limited, Zydus Lifesciences Limited)
📉 2 Decrease in Holdings
(DLF Limited, Premier Energies Limited)
⏸️ 22 Companies - No Change
(Held steady on: Reliance Industries, Bharti Airtel, Adani Enterprises, Adani Green Energy, ICICI Bank, Aurobindo Pharma etc.)
The portfolio stays concentrated across 26 stocks anchored by Telecom (13.0%) and Energy/Petroleum, backed by an active -14.3% equity derivatives hedge and a combined 10.7% precious metals allocation.
Detailed 1-Pager attached! 📄


DSP Multi Asset Portfolio Update (Sep 2026) 📊
National Stock Exchange (NSE) officially enters the fold! DSP added IRB InvIT this month, while aggressively ramping up exposure in Hindustan Zinc (+13.1L shares). Equities and international holdings expanded across the board as debt took a backseat.
Asset Allocation Changes :
Equity ⬆️
International Equity ⬆️
Reits/InvITs ⬆️
Gold ⬇️
Debt ⬇️
🟢 6 Fresh Buys
(Includes: Irb Invit Fund, National Stock Exchange of India, Nuvoco Vistas, HDFC Life Insurance, Timken India, Advantest Corp)
🔴 0 Full Exits
(None this month)
📈 15 Increase in Holdings
(Including: Hindustan Zinc, Tata Motors, BPCL, Bharti Airtel, Larsen & Toubro etc.)
📉 1 Decrease in Holdings
(Info Edge (India) Limited)
⏸️ 53 Companies - No Change
(Held steady on: HDFC Bank, Axis Bank, ICICI Bank, Reliance Industries, Embassy Office Parks REIT, State Bank of India etc.)
The portfolio stretches across 75 listings with total equity exposure (domestic + global) crossing 59%, while maintaining a disciplined 11.7% allocation to gold.
Detailed 1-Pager attached! 📄

