Butch 💹 (@Butch21000000) header
Butch 💹 (@Butch21000000) profile picture

Crypto Analyst | Industrial Engineer M. Sc. | Specialized in Bitcoin Cycles & On-Chain Metrics | Rare Indicators

Berlin, Deutschland
Joined March 2023
Photo by Butch 💹 (@Butch21000000)Photo by Butch 💹 (@Butch21000000)Photo by Butch 💹 (@Butch21000000)Photo by Butch 💹 (@Butch21000000)Photo by Butch 💹 (@Butch21000000)Photo by Butch 💹 (@Butch21000000)Photo by Butch 💹 (@Butch21000000)Photo by Butch 💹 (@Butch21000000)Photo by Butch 💹 (@Butch21000000)Photo by Butch 💹 (@Butch21000000)
According to the Crypto Trend Indicator on this long-term BTC chart, we’re right at a critical crossing point. Either the worst of this correction is behind us, or we’re about to flip back green and resume the uptrend. Historically, every touch of this indicator has marked major bottoms and epic rebounds. #Bitcoin #BTC #Crypto #Trading
2
25
6,087
$BTC weekly just lost the Bull Market Support Band. Same structure as early 2023. Price is now trading below the band for the first time in this correction. #Bitcoin #BTC
2
3
163
69k tagged. Exact hit on the Q20 band from the Mean Reversion levels we marked earlier. Structure is being tested right here.
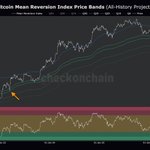
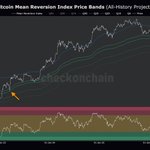
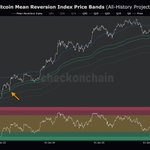
$BTC Mean Reversion Index is at 25.4 and sitting deep in the lower zone again. The orange marks line up with the same area we saw in early 2023. Still room toward the Q20 band around 69k before this structure fully matches that prior low. #Bitcoin #BTC
2
176
$BTC Stablecoin Net Position Change is deep in the red again. Aggregate supply is flat to slightly declining while recent flows show clear outflows. Liquidity is leaving the market. #Bitcoin #BTC
2
174
$BTC is giving up the key levels one by one. STH cost basis and True Market Mean are already being tested. Below us still sit the 200-week and the Realised Price. Structure is thinning out. #Bitcoin #BTC
145
$BTC Mean Reversion Index is at 25.4 and sitting deep in the lower zone again. The orange marks line up with the same area we saw in early 2023. Still room toward the Q20 band around 69k before this structure fully matches that prior low. #Bitcoin #BTC
2
6
2,039
$BTC Bollinger Band Range just dipped back into the lower zone. The purple area shows how compressed the bands are right now. Historically these tight readings have preceded the stronger moves once the range starts expanding again. Volatility is coiled. #Bitcoin #BTC
3
156
$BTC Short-Term Holder MVRV is back at the 1.0 line. The red and green marks show the previous flips. The regime change between profit and loss for recent buyers is clearly visible again. #Bitcoin #BTC
7
220
$BTC is testing the 0.5 Fib around 72.7k. If this level fails, the volume profile shows a strong high-volume node right at the 0.786 (~64.3k). That zone has historically acted as solid support. #Bitcoin #BTC
162
$BTC is still sitting right around the white line on the chart — roughly 400 days after the cycle ATH. That’s the same stretch where every prior cycle had already put in its low. The bears are running out of time. The best part is still ahead of us. #Bitcoin #BTC
3
215
Global liquidity is still riding the 65-month wave. The dashed red line marks the long-term cycle, the white line is the GLI. Bitcoin has moved with these waves in the past. Right now we are sitting in the later part of the cycle — the liquidity backdrop still matters more than the daily noise. Source: @crossbordercap #Bitcoin #BTC #Liquidity #Macro #GLI
2
126
$BTC Choppiness Index is climbing back toward the 61.8 zone on the weekly. Purple areas mark the periods when the market was stuck in consolidation. The index is rising again, which has usually meant more chop before the next clear move. #Bitcoin #BTC
5
161
$BTC is sitting right on the STH Cost Basis and True Mean Price. A weekly close below these levels would put recent buyers underwater and has historically led to more selling pressure. #Bitcoin #BTC
1
166
$BTC is getting close to the next meeting between the 50-week and 200-day averages. Previous times these two lines came together, price spent a while moving sideways before the next push. #Bitcoin #BTC
1
8
334
$BTC 1-year Sharpe Ratio is back in the lower zone. The orange boxes mark the prior periods when the ratio compressed this far. Same structure as the earlier resets. #Bitcoin #BTC
1
2
192
$MSTR monthly just saw the RSI cross back above the orange line from below. The last two times this happened, the measured moves were +525 % and +2,621 %. Same setup is forming again. #MSTR #Strategy #Bitcoin #BTC
1
170
$BTC has tracked US net liquidity closely for years. The green area is the Fed balance sheet. Total liquidity is still elevated after the post-2020 expansion. Price is consolidating while the broader liquidity backdrop remains supportive. #Bitcoin #BTC
1
166
$MSTR is showing the same structure as the prior cycle lows. A lot of BTC bottom indicators stayed mixed this cycle. Strategy was clear. The white arrows mark the earlier resets before the next leg higher. The best is still ahead. #Bitcoin #MSTR #BTC
6
267
$BTC STH-SOPR is back near 1.00. This shows whether short-term holders are selling at a profit or loss. The orange dots mark the prior times they went underwater before the next recovery. No panic — same structure as the earlier resets. #Bitcoin #BTC
4
210
$BTC RHODL Ratio is consolidating sideways at the same level as the prior cycle resets. The orange circles mark the earlier periods where the ratio held this zone before the next leg higher. #Bitcoin #BTC
1
1
3
192