

I don't have a Telegram account and don't sell newsletters.
Joined April 2014
- Tweets22.7K
- Following482
- Followers59.6K
- Likes42.8K
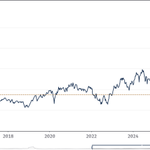
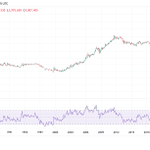
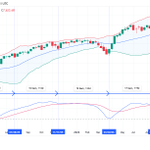
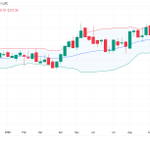
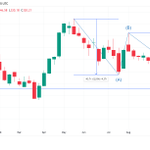

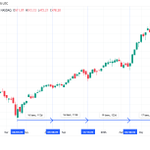
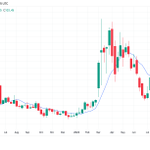
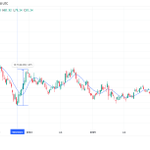
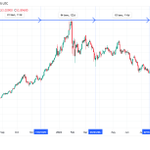
The forward PE of $SOX at the 2022 low was 12.8 and at the 2018 low was 11.5. Semis had a parabolic run from April 2025 to June 2026 and these parabolas always end with a bear market. It's just a historical fact. Typical drawdowns in the past were 43%-55%.
xitter.cf/GroupFinom/status/2114…


As usual gold bogs are disconnected from reality. In July 1999 gold had been in a 20 year bear market with a monthly RSI at 27 and was the most hated risk asset. Now it's only 9 months into an early stage bear market coming off the highest RSI in history.
xitter.cf/DonDurrett/status/2114…


Wow, Gary drops the hammer! Read what he has to say below. He thinks gold is dead until 2029!
As De Niro said in Heat, there's a flip side to that coin.
When the stock market crashed in 2000, gold was around $250. That crash occurred after an 18-year bull market. Gold proceeded to rip from $250 to $1900 over the next decade, as the stock market languished.
We are currently in a 17-year bull market on Wall Street that has similar overtones. In 2000, it was the dot-com bubble. Today, it is the AI bubble.
But it's even worse. Today, we also have a debt bubble and an inflation problem. Neither of those existed in 2000.
So, riddle me this Batman, if the stock market falls and ignites a fear trade, do you really think gold is going down, or will get stuck at these levels? 🤔
$SPX - The next 16-17 week cycle low is due in the 2nd half of November. The last 17 week cycle was very bullish but this one is more similar to the one from November 2025 to March 2026(see the TSI). Therefore, this time it's likely to at least hit the lower BB in November.


The huge number of likes for this post tells you all you need to know about where silver is headed in the next 3 years. It's headed to $20, not to $200. xitter.cf/hajiyev_rashad/status/…


$SOXX is going to break the July low. The next intermediate term low is due at the next 16-17 week cycle low that is due in November. The cycle from November 2025 to March 2026 was longer due to the Iran war and it may be longer again if there's another Iran war in November.


$TLT has confirmed that it made an intermediate term low by closing the week above the 10 week MA. When it made intermediate term lows in October 2022 and October 2023 it rallied $18 into its next intermediate term high. A repeat of that would take it to around 94.43 this time.

$Silver has broken the July low and closed the week at 53.89. There's a 81-84 trading day cycle that goes back to the April 2025 low. This cycle indicates that the next intermediate term low, which will also be the low for 2026, is due on November 11 plus minus 2 trading days.


$QQQ - So far it's holding above the support at 700. In order to bounce to the top of the range(728) it would have to trade above 715(gap). Next week, there's still a chance that instead of a bounce we will see a washout to 680 which is near the 200 day MA, and only then bounce.


$BTC - The close above the 20 DMA on Wednesday was reversed yesterday, so a new high for Q4 will probably not happen anytime soon. Notice that it hasn't closed below the lower BB since June, so a close below the lower BB will confirm that a decline into late November is underway.


$META - Today's action has confirmed that it made an intermediate term top on Sep 24. The next support is gap support at 638 but it's probably headed lower into the 2nd half of November. Overall, it's a continuation of the price mess of the last 52 weeks. no clear pattern here.
