

Techno Funda Researcher with vivid interests and passion towards Architecture | Tennis | Travelling| Trekking | History | Photography
Joined July 2020
- Tweets4.8K
- Following141
- Followers7.3K
- Likes5.8K





Pinned Tweet
CNX IT
Last week was a brief challenge for the Indian IT stocks based on the potential impact of AI on the future of majority IT companies!
The sell-off, which began on 04 February, intensified after artificial intelligence firm Anthropic unveiled a new AI tool capable of automating complex tasks, raising fears of structural disruption across the outsourcing industry.
The market is worried about how new technology provides opportunities by unlocking incremental addressable spend. Indian IT companies, which derive a substantial portion of their revenue from the U.S., remain particularly sensitive to changes in the American economic outlook.
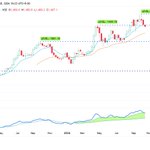
Let's observe what is seen with the CNX IT chart and whether we can be take timely informed decisions.
➡️CNX IT hit a high of 39446.70 in January 2022
➡️We witnessed a triple bottom at 26184.45 from July 2022 to April 2023
➡️CNX IT crossed 39446.70 after a year in July 2024
➡️This gave a decisive upside to 46088.90 in December 2024
➡️Next came the sell-off which led to a double bottom scenario at 31320.15
➡️The pullback to 39446.70 happened thrice in June 2025, December 2025 & February 2025
➡️Last week's sell-off has given a retest of 31320.15 which is also a visible neckline for the Head & Shoulder pattern observed
➡️A breakdown below this critical neckline will give way for 26184.45 & 23926 in the short to medium term
➡️Full target potential is much below which won't be feasible to talk as of now. We need to observe the situation and let things unfold step by step
➡️Any reversals should be taken as opportunities to exit positions, and potential longs at the IT Index level can be taken into consideration only above 38560-39450 zone!
Can AI disrupt or give an opportunity for Indian IT stocks?

Shalin Shah retweeted

This table should probably be it's own 3 hours masterclass video, but sharing it first here..
For anyone studying Martin's pullback strategy key question is "What moving averages shall we use"?
This table answers that.
And it shows what to expect of each.
For longs, 21 EMA is the clear sweet spot. 50 EMA is borderline no-go (but small sample)
For shorts, win-rate improves steadily as EMA increases, but 9 EMA still produces the highest mean R and avg gain
Here's some additional valueable key insights:
Martin's pullback setup was first developed for the short side
MARTIN LUK: Actually I learned the pullbacks mostly from the short side first... For shorts, the best risk-reward play should be shorting at the resistance, right at the bounce or the pullback into the declining EMAs or into the resistance levels. So this is how I really dig deep in the pullback side, and also I just flip the short side around and then it will be the long side, and they are really similar.
Why does he take 2/3 of his pullback longs at the 9 EMA when 80% fail, whereas 21 EMA longs has almost double win-rate and triple expectancy?
MARTIN LUK: Then I bought it at the pullback on the daily 9 EMA... I think this one would be a fair entry. Definitely not the best one because it's like a slight pullback, and generally a pullback to the daily 9 has the lowest win rate amongst—or like a slower EMA will have the highest win rate—from my study. But sometimes stocks, you have to take risk. Sometimes if the stock pulls back to the 21, then you have a better entry, more high-win-rate entry, you have more conviction, or the risk-reward will be much better. But sometimes the stock, if it's strong like Tesla here, it doesn't pull back to the 21. So this time I'm just trying to take a risk and trying to test whether it works or not
If we go back and look at the uptrend, especially a strong uptrend that the semi sector has made or the Qs has made: a lot of the times we get an uptrend, then we pull back into the 21 EMA and re-bounce at the 21, and then we start another uptrend—we start another leg up.
WHY NOT JUST SKIP 9 THE 9 EMA FOR LONGS?
Runaway Stage 2 leaders (MRVL, AAOI, NBIS, etc)
surf the 9 EMA without touching the 21 EMA for weeks. To not miss the strongest momentum stocks in the market, Martin probes the 9 EMA aggressively with ultra-tight ~1.2%–1.5% stops
WHY DOES 50 EMA LONGS FAIL, BUT 50 EMA SHORTS WIN?
Don't have a good answer for that, yet.
MARTIN LUK: I don't have a really good statistic on that, but... I tried this recently with the cybersecurity longs like NET. Before them, I think I rarely tried this type of pullback buys just purely off the 50 EMA. To me, it's a little bit more difficult and I'm still not good at doing that. I would prefer a pullback buy into the EMA convergence—when the EMAs are converging really close to each other—instead of purely buying the pullback into the 50 EMA.
Compare that to how he describes his bread-and-butter 50 EMA Short:
MARTIN LUK: Stocks tend to decline immediately, without further basing, right after being rejected at the declining moving averages, particularly the 21 and 50 EMAs. The tighter the EMAs, the higher the rejection rate.
I think the ideal picture-perfect [short] would be the first breakdown of the 50 EMA and then the first pullback into the 50 EMA—and generally when [you get] the first breakdown and then a pullback into the 50 EMA, the 21 or the 9 would also be really near the 50 EMA too, and they start curling back and crossing down the 50 EMA
---
A ton of other insights related to this particular chart.



Pharma names are ruling the price action + quarterly numbers combination this Diwali 🪔
Divis Laboratories
Lauras Labs
Zydus Lifesciences
Aurobindo Pharma
Glenmark Pharma
Gland Pharma
Emcure Pharma
J B Chem & Pharma
Sai Life Sciences
Piramal Pharma
Acutaas Chemicals
Alembic Pharma
Corona Remedies
Indegene
Symbiotic Pharmalab
Entero Healthcare Solutions
SMS Pharma
Evonile Pharma
Shukra Pharma
Fredun Pharma
1
5
1,784
Wishing everyone a Happy Diwali 🎇🎆
Hope that all of us prosper and grow together in this Festival of Lights 🪔

2
519
Shalin Shah retweeted

OUTRAGEOUS TENNIS 🤯🔥
@carlosalcaraz #RolexParisMasters

Praveg Ltd
Market Cap: 545 cr
Market Cap 3 years back: 974 cr
2022- Start of upmove from 133.70
2024- Hits all time high of 1292.95
2026- Hits low of 174.65
Sales
FY22- 45 cr
FY23- 84 cr
FY24- 92 cr
FY25- 167 cr
FY26- 241 cr
Profit After Tax
FY22- 12 cr
FY23- 28 cr
FY24- 13 cr
FY25- 16 cr
FY26- (-10) cr
Seems Kumbh Mela was the tipping point for the company.
Interestingly, few FIIs & DIIs hold this stock from FY23 onwards!
Q2 & H1 FY27- Concall
Current hospitality footprint: ~927+ rooms across 17 resorts and one five-star hotel across multiple states/UTs and Lakshadweep.
H1 FY27: 55,925 room nights vs 44,959 in H1 FY26; management expects to exceed prior-year H1.
Cost advantage: conventional hotel construction “1.25 to 1.5 Cr per room” vs their semi-permanent structures “60 to 75 lakhs per room.”
Announced features of the (newly launched) Lakshadweep property: 100 unique accommodations (85 cocoon-shaped + 15 shell-shaped rooms) plus F&B, spa/yoga, scuba/water sports, outdoor MICE, and a conference hall up to 400 guests.
Multiple growth vectors—Lakshadweep ramp, Meghalaya capex project, Alibag, Serengeti—but near-term P&L sensitivity hinges on ramp speed + flight connectivity constraints (explicitly cited for Lakshadweep).
Near-term profitability is being hit by regulatory cost/tax changes + fixed-cost structure + depreciation from recent openings.
Management provided explicit occupancy-to-profit mapping (property-level thumb rules):
30–40% occupancy: break-even
40–55% occupancy: 20–25% EBITDA margin
65–75% occupancy: “40% plus EBITDA margin”

1
718
Sai Silks (Kalamandir) Ltd
Market Cap: 1057 cr
Stock has corrected from 312 to 64 since listing!
* TTM sales at 1650 cr
* OPM at 15%
* PAT at 137 cr
* Cash 348 cr
* Debt Free
* Business to be assessed on Yearly basis and not on Quarter on Quarter basis
* Innerwear and Jewellery segment growth to be seen
Key concern might be:
* Inventory of 816 cr
* Cash conversion cycle of 250 days
* Rent to Revenue ratio
* No of Employees 6311
* DIIs have reduced their stake from 20% to 4% in two years

1
812
Colgate Palmolive (India) Ltd
Market Cap: 43,225 cr
Jan 2024: 1434.60
Sept 2024: 3890
Oct 2026: 1576
All the gains of two and a half years has gone away!
What has changed for Colgate in these years?

1
582
Indian Hotels Co Ltd
Market Cap: 1,11,497 cr
FY27 consolidated revenue-growth guidance upgraded from 12–14% to 15–17%, supported by stronger hotel demand, improved pricing and robust H1 execution.
Q2 FY27 indicator Performance
Consolidated revenue ₹2,566 crore
Revenue growth +21% YoY
Consolidated EBITDA ₹788 crore
EBITDA margin 30.7%
PAT ₹349 crore
PAT growth +23% YoY
Domestic same-store RevPAR growth +25%
H1 hotel signings 47
Management identified stronger domestic demand, improved hotel occupancy, higher room rates, increasing management-fee income and contributions from recently acquired businesses as the principal drivers.
As observed, the stock has corrected since January 2026 and showing a breakout above the 750 level.
With key support at 700, stock can show further strength on better H2 performance and approach 816, 895 and beyond.
Q3FY27 is festive season and year end season.

1
2
686
HDFC Bank
Market Cap: 10,97,804 cr
Market Cap 3 years back: 8,98,094 cr
Market Cap 5 years back: 8,23,425 cr
Q2FY27 Concall concluded on 17th October 2026.
Deputy MD Kaizad Bharucha, one of the key architects of the credit architecture, has requested early retirement by December.
Incoming CEO Anup Bagchi outlined near-term approach: engage regulators/customers/shareholders to gather insights; promised to return with a perspective on “growth, margins, quality, and productivity… built on discipline, capital deployment, and a strong execution culture grounded in governance, excellence, and trust.”
Management stated explicitly that Q2 margin is the bottom, with the trajectory turning upward from Q3. The 25 bps rate hike in October provides a tailwind on the ~70% of the loan book that is floating-rate, largely repo-linked.
What to watch next quarter: Whether the promised NIM uptick materializes given the full-quarter FCNR drag, how the new CEO frames strategic priorities, and any clarity on the draft insurance commission norms' financial impact.
As observed, a potential Head & Shoulder pattern is visible in the HDFC Bank chart. Can we see a revisit of the market cap which was 3 to 5 years back?
With the stock now below the neckline, the overall trend remains bearish as of now.
1) Weekly EMAs have given a negative crossover, and one scenario is a breakdown below the key level of 653 & stock continues the downward trend.
2) Bulls will need to work really hard to reverse this trend and a consolidation between the right shoulder & level of 653 is vital for them.

2
972
Quality Power Electrical Equipments Ltd
Market Cap: 10,897 cr
FY26 PAT: 186 cr
TTM PAT: 195 cr
Two key announcements in the past couple of days:
1) Quality Power Electrical Equipments Limited has commenced manufacturing operations at its new Global Coil Factory at Kupwad MIDC, Sangli, Maharashtra, with effect from 20 October 2026, coinciding with the auspicious occasion of Vijayadashami (Dussehra).
The greenfield facility has been developed as a major manufacturing centre for high-voltage air core dry-type reactors and specialised coil products, catering to HVAC, HVDC, FACTS, renewable energy integration and other critical power transmission applications.
The facility incorporates advanced coil winding infrastructure, dedicated high-voltage testing capabilities and integrated conductor processing facilities, including manufacturing capabilities for specialised HVDC winding conductors. The investment is intended to strengthen manufacturing integration, improve production efficiency and enhance the Group's ability to execute large and technically complex international projects.
2) The new Power Conversion Systems (PCS) manufacturing facility of our subsidiary, Endoks Energy Systems, at Niğde, Türkiye, commenced manufacturing operations on 16 October 2026. Thanking you, Yours faithfully, The facility is dedicated to the manufacturing of power electronic converters and inverters for utility scale Battery Energy Storage Systems (BESS) and other grid-connected applications.
As observed, stock is now below recent high of 1439.70 and approaching key levels of 1333-1264-1081.
Opportunity for bulls or Hunting ground for bears?

Cyient DLM — Profitability guidance downgrade
15 October 2026 earnings call and investor presentation.
Management reduced its FY27 EBITDA margin expectation from approximately 10–11% to 9–10%, reflecting higher investment expenditure and changes in revenue mix.
Why guidance was reduced: The company is investing in sales capabilities, product development and new growth opportunities.
Management also identified adverse revenue mix and product-development purchases as contributors to margin pressure. Material availability is affecting order execution timelines.
Close below 873 will not bode well and we can see 811-757 getting tested.

2
836
Nifty
11/10/2026
What do we observe from the below chart?
A triple top clearly seen and now Nifty is retesting the support zone of 22182-21743.65
The relative strength (compared vs Nasdaq) clearly gave an inherent weakness from August 2025 to December 2025 while the Nifty went up. From January 2026, Nifty gave way and is down -16% till date.
Last week's low was 22179.90 and any reversal from here will be crucial for bulls to escape from any further strikes from bears! A sharp pullback will give respite and keep the channel intact.
Any breakdown below this will be clear bear territory and can possibly open testing of lower levels- 21949.15-20500-19051.
It is an interesting week ahead for Nifty and till we hit Diwali!

7
1,442
Urban Co
Market Cap: 23966 cr
Stock is showing good momentum after Q1FY27 commentary.
Q1 FY27 Snapshot: Strong Start; Core Profits Funding InstaHelp
Consolidated NTV: ₹1,465 crore (+42% YoY)
Revenue: ₹528 crore (+44% YoY)
Orders: 13.2 million (+79% YoY)
Customer adds: ~1.2 million new customers (first time crossing 1 million in a quarter); annual transacting users (ATU): 9.3 million
Adjusted EBITDA: ₹(65) crore, “almost entirely driven by InstaHelp’s loss of ₹(132) crores”Ex-InstaHelp: ₹67 crore Adj. EBITDA profit (+116% YoY)
Guidance reiterated: Consolidated Adj. EBITDA breakeven by Q3 FY28; ₹1,000 crore Adj. EBITDA by FY31
Key strategic framing: Management emphasized Urban Company is balancing a “very strong core profitable engine” while “investing aggressively in InstaHelp to cement our leadership.”
Engineering productivity: “more than 90–95% of our code now is written by AI,” implying cost/headcount leverage
AI-driven marketing workflows (creative → deployment → optimization → redeployment) They emphasized AI is not just cost takeout but intended to “make our marketplace significantly healthier and improve our quality of service.”
Over next ~2 years: Core India + International expected to remain profitable/cash-generative; margin expansion to be “disciplined,” not aggressively optimized at the expense of growth.
If the positive narrative plays out in the coming quarters, then upcoming resistance levels of 163-177.50-201 will be tested upon.

1
2
606
Active participation by investors and traders has gone down substantially today.
Fatigue playing out for everyone as Nifty falls for the 12th consecutive day!

ICICI Bank and HDFC Bank are at almost similar market caps now.
ICICI Bank is at 52 week high
HDFC Bank is at 52 week low
Which one will you prefer to buy?


1
781
BASF India
Market Cap: 17,559 cr
The company receives strong operational as well as product support from BASF SE, one of the world’s leading chemical companies. High level of integration between the parent and the Indian arm reflects synergies arising from similar businesses.
Stock gave a strong set of Q1FY27 numbers with OPM touching 10% after ten quarters.
Technically, the stock has tested the resistance zone of 4063-4235.
Weekly close above this resistance zone along with subsequent good Q2FY27 will bode well for the stock and an upside till 4501-4832-5115-5366.50 can be anticipated.
Key support zone is at 3840-3615. A weekly close below this zone will nullify the bullish view.

