

Power BI reports that make a difference 🚀 training 1.4M + followers in Power BI across social platforms 👉🏼https://xitter.cf/t.co/lWIqE7UzQo https://xitter.cf/t.co/lWIqE7UzQo
Düsseldorf
Joined September 2020
- Tweets6.2K
- Following222
- Followers22.8K
- Likes1.5K

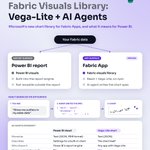







Fabric lets you build small apps on top of your data (still in preview).
The charts in those apps don’t use Power BI visuals. They use Vega-Lite, an open chart language.
What is the difference?
- A Power BI visual is also saved as text (JSON in the PBIR format). But it’s only settings for a built-in chart, and only Power BI can draw it.
- A Vega-Lite chart describes the chart itself, so any app can "draw it".
That means:
+ AI can write a chart from plain words, like “show me outliers in my sales data” and it will decide the chat.
+ You can reuse the same chart in any app, instead of rebuilding it inside one report.
What this means for Power BI people?
✅ Your Power BI reports stay the same
✅ Fabric Apps get their own charts
✅ More of the work becomes checking what the AI built: is it the right chart, and does it match your brand?
*If you’ve ever used Deneb in Power BI, you already know Vega-Lite.
Save it and share it so more people know what's up 💛
#powerbi #fabric #vegalite #deneb #json #pbi

Do you have "unique" Power BI charts that your organization needs in every new report?
No need to rebuild them ever again!
Once you follow these steps Claude builds exactly these charts for you.
On any report, any dataset.
If you want to know more, the full blog post and video are in the comments.
#powerbi #ai #skills #visuals #claudecode

What makes a Power BI project actually successful?
I've put together a free whitepaper covering 6 key steps that can help you approach Power BI projects with more structure and purpose.
And a few of the steps might not be what you'd expect 👀
Get the free whitepaper - link in the comments.
#powerbi #skills #success

What are you prioritizing this year?
20%Technical depth
70%AI skills
10%Business knowledge
0%Leadership skills
10 votes • 22 hoursRead about it:
datatraining.io/blog/list-sl…

The October 2026 update added dropdowns, images and pills to List Slicer! ⬇️
Save it for later or share it so more people can learn 🚀
Want to read about it? Check out the link below
#powerbi #powerbiupdate #analytics #data


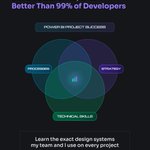
Great Power BI reports aren't built on technical skills alone.
The best ones sit where technical skills, strategy and processes overlap. Learn the exact design systems my team and I use on every project, so your reports look sharp, make sense to the business and come together faster.
Link in the comments ⬇️
#powerbi #reportdesign #data #skills

Everyone uses AI to make things.
I think we should use it more to break things.
Most DAX measures get tested on the happy path. A normal month, normal data, the numbers look right, done. "Looks good".
And then "the numbers look wrong" nightmare starts.
So before I ship a measure (or for the ones we already shipped), I add one extra step.
I show it to AI and ask:
“What inputs could break this?”
It comes back with a list:
→ Blank or missing dates
→ Negative values
→ A customer with no sales
→ A month with only one day of data
→ Filters that remove every row
Some of these are obvious. Others are the kind of edge case that would only show up months later in production.
AI is a good builder, but it might be a great tester.
Ask it to break your measure (or even the entire report) before your users do.
Is this part of your process now to? 👇🏻
#powerbi #ai #data #analytics

October 2026 Power BI Update brings what we have been waiting for 10 years!
The native Gantt Chart (!) supports large project timelines with collapsible phases and color-coded bars 🚀
#powerbi #powerbiupdate #ganttchart
Most teams still run everyday processes on spreadsheets, email chains and one-off SaaS tools.
You can build them as Fabric Apps instead, secure and sitting right on top of your data ⬇️
Here are 3 we built:
1️⃣ Leave Manager: employees request time off and see their remaining days, managers approve, and HR manages allowances and holidays.
2️⃣ Month Close: controllers explain every variance over the threshold, reviewers mark lines final, and the commentary goes straight into the month-end pack.
3️⃣ Desk Booking: pick a desk on the floor plan, filter for a monitor or quiet zone, and see which teammates are in that day.
Security is built in:
🔒 Role-based access, so employees, managers, reviewers and admins each see and do only what they should.
🔒 Clear rules: nobody can approve their own leave, and only you can change your own bookings.
🔒 A full audit trail that shows who wrote what and when, and edits after the lock need an admin and a reason.
🔒 Your data stays in Fabric, governed like the rest of your platform.
Want to see how it’s built? I walk through the Desk Booking app step by step in the full video (link in the comments 👇🏻).
Have a process your team still runs on spreadsheets and emails? DM us, and our team will help find the best solution.
#fabric #fabricapps #analytics #data


Do you use field parameters?
#powerbi
41%In most reports
47%Sometimes
6%Haven't tried them
6%Never heard of them
17 votes • Final results
Power BI just got the dropdown slicer feature we’ve been waiting for! 🚀
Watch the full video on YouTube!
#powerbi #data #analytics #slicer #dropdown

One course. The whole picture of Power BI - end to end 🙌🏻
11 modules · 105+ lessons · ~22 hours covering Power Query, data modeling, DAX, visuals, the Service and deployment. Plus prep for the PL-300 Certificate.
Link in the comments ⬇️
#powerbi #PL300 #dataanalyst #datatraining
