

computational and systems biology
- Tweets37
- Following190
- Followers68
- Likes206



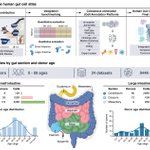

ALT HGCA Figure 1a-b. A workflow links global data contributions and public review to integration benchmarking, expert annotation jamborees, evidence review and consensus cell identities. The resulting atlas includes 944,390 cells from 24 datasets and 265 donors aged 0-89. A gut diagram and bar charts show coverage across intestinal regions and donor ages. The atlas combines healthy and disease-adjacent tissue.

ALT HGCA Figure 5c-f. A dot plot compares organoid cell subtypes with their declared intestinal region across adult, fetal and pluripotent stem-cell sources. Three circular treemaps show changing cell composition and similarity to adult HGCA cells over culture time. A scatterplot across 41 samples from 9 publications shows decreasing distance to the adult reference with maturation. Cell-type-specific estimates show that this trend is not uniform across identities. Adult-like maturation and regional specification are distinct dimensions.


