

What can we expect from financial markets in the coming week? Data and analysis from a PhD, MFE every weekend.
Joined May 2026
- Tweets182
- Following15
- Followers31
- Likes19
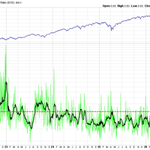

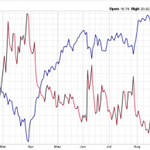
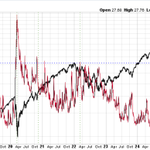


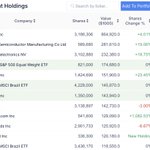
This week's report "The Coast Is Not Clear" explains why risk still lurks in the shadows. We may not have seen the end of this correction.
More in the replies below ...
marketsnextweek.substack.com…
When the RAMO drops below zero after initially crossing over 75, it can sometimes signal the start of a correction or pullback. While the oscillator has not crossed over 75 recently, it just dropped below zero. I see this as a weakly cautionary sign.

1
9

This week’s report shows why the current liquidity backdrop suggests a larger decline ahead even though the coming week leans bullish.
marketsnextweek.substack.com…


6
From our October 4 report:
"For stocks to go up, there must be buyers. The usual sources of equity demand look depleted, and they are not likely to be replenished soon. Therefore, in our view, US stocks are still vulnerable to a sharp correction."
Report linked below.

Investors are underestimating the fragility of the US stock market.
The latest weekly report is now available: marketsnextweek.substack.com…
The latest Markets Next Week report has been published. Reports in the last month have repeatedly warned about a lack of liquidity, and the vulnerability to crashes that it produces. Not much new to report this week. We are watching signs carefully. marketsnextweek.substack.com…
16
From the October 22 Report:
"""
There is a fundamental reason why we spend so much time looking at liquidity. Benjamin Graham, the author of The Intelligent Investor and a mentor to Warren Buffett, wrote:
"In the short run, the market is a voting machine, but in the long run, it is a weighing machine."
Here is what it means and how it relates to liquidity:
- In the long run, the prices of investments must reflect their valuation as determined by their long-term cash flows. These cash flows are decided by business fundamentals like revenue growth and profit margin. People who invest in businesses with strong fundamentals become wealthy because of the cash generated by these businesses. The valuations of such businesses eventually rise as more and more investors take note of their cash generation.
- In the short run, the price of any stock, regardless of underlying business quality, can rise rapidly. This happens when demand for the stock outstrips supply. This can happen to a single stock, a sector, an asset class, etc. When the effect is outsized, we use the term bubble to loosely describe the phenomenon. When the fundamentals (future cash flows) of a business become disconnected from its stock price, the price must eventually correct. But when is eventually? Eventually is when liquidity runs out. Unnatural extremes of valuation end when speculators can no longer secure funds to keep bidding up the prices of their favorite securities. This is why we watch liquidity closely. What we are seeing now is that liquidity is no longer growing. What remains is to ascertain whether the “Pause” button has been pressed on liquidity or the “Stop” button.
"""
The beginning of bearish fatigue?
The October 22 Markets Next Week report is now available.
marketsnextweek.substack.com…
The beginning of bearish fatigue?
The October 22 Markets Next Week report is now available.
marketsnextweek.substack.com…
The October 15 report is out.
In a few words, new money is not entering stocks, and money that left smaller stocks to chase mega caps is now leaving the mega-caps. Some of it is going to other stocks; the rest may leave equities altogether. marketsnextweek.substack.com…

Markets Next Week retweeted

"Narrow Market Top" setup? Only one bellwether—Financials—has confirmed the S&P 500's latest high; the others still have much ground to make up. That's the same number of red flags as March Y2K. At the 2007 top, all 8 were flashing warnings. At minimum, investors should be uncomfortable. #SP500 #Stocks

I have shown the results of the chart below in the form of a table. Here's what it says:
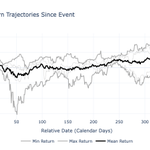
After periods of very low cash allocation (5 cases), the market continued to move up for a few weeks in a majority of cases, but average returns were negative after 1, 2, 3, and 6 months.

Here is what the stock market did after the dates below. The black line shows the average return, and the upper and lower dark gray lines show the range of past outcomes. Historically, low cash allocations have been followed by high volatility and low returns.

34
Short-Term Bullish, Medium-Term Bearish. This week's report explains why the market looks, well, as described in the title. marketsnextweek.substack.com…
21
The latest AAII Allocation Survey says that investors have just 13.3% of their portfolio in cash. This number falls in the bottom 1% of its history.
Here are other months when cash allocation was under 14%:
Mar '98
Dec '99
Nov '17-Jan '18
Jan '20
Jul-Aug '21
The common theme..

Investors are underestimating the fragility of the US stock market.
The latest weekly report is now available: marketsnextweek.substack.com…
Here is what the stock market did after the dates below. The black line shows the average return, and the upper and lower dark gray lines show the range of past outcomes. Historically, low cash allocations have been followed by high volatility and low returns.
We see indicators at levels that are normally seen near market bottoms. Yet, the S&P500 has been moving sideways. Are we at a bottom, or is the market going to crash?
The September 25 report examines the evidence:
marketsnextweek.substack.com…
