

What can we expect from financial markets in the coming week? Data and analysis from a PhD, MFE every weekend.
Joined May 2026
- Tweets182
- Following15
- Followers31
- Likes19
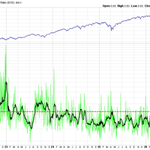




For a significant bottom, I want the 10-day moving average of the CBOE Equity Put/Call ratio to at least touch 0.7. It stands at 0.63 as of Friday.

11
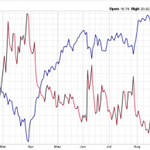
When the RAMO drops below zero after initially crossing over 75, it can sometimes signal the start of a correction or pullback. While the oscillator has not crossed over 75 recently, it just dropped below zero. I see this as a weakly cautionary sign.

1
9
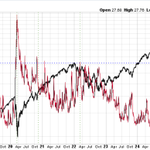
The VIX sat elevated at 19.30 as of Friday. The pattern of highs and especially lows in the VIX resembles the early stages of past corrections.

1
8
This week's report "The Coast Is Not Clear" explains why risk still lurks in the shadows. We may not have seen the end of this correction.
More in the replies below ...
marketsnextweek.substack.com…
This week’s report shows why the current liquidity backdrop suggests a larger decline ahead even though the coming week leans bullish.
marketsnextweek.substack.com…


6
From our October 4 report:
"For stocks to go up, there must be buyers. The usual sources of equity demand look depleted, and they are not likely to be replenished soon. Therefore, in our view, US stocks are still vulnerable to a sharp correction."
Report linked below.

Investors are underestimating the fragility of the US stock market.
The latest weekly report is now available: marketsnextweek.substack.com…
Agree with the conclusion, and I have been writing about it myself, but 1-year is too long to be averaging options.
187
The latest Markets Next Week report has been published. Reports in the last month have repeatedly warned about a lack of liquidity, and the vulnerability to crashes that it produces. Not much new to report this week. We are watching signs carefully. marketsnextweek.substack.com…
16
Exactly. Selling more and more for less and less works only if margins remain positive. The cost of inference is being driven down too rapidly.
1
9
Confirms a similar observation in AAII allocations. Thanks for sharing.
teapaw.org/MarketsNextWeek/status…
The latest AAII Allocation Survey says that investors have just 13.3% of their portfolio in cash. This number falls in the bottom 1% of its history.
Here are other months when cash allocation was under 14%:
Mar '98
Dec '99
Nov '17-Jan '18
Jan '20
Jul-Aug '21
The common theme..
3
The effect -that winners continue to win- is correct. However, the magnitude is not so big. Results are likely affected by survivorship bias.
I ran a similar experiment on today's S&P500 and achieved >50%/yr. Knowing which stocks will be in the index decades later is priceless.
1
4
2,600
Exactly.
I have been puzzling over the apparent contradiction between a benign Put/Call Ratio and charts like the one below.
teapaw.org/MacroCharts/status/211…


7
Thanks for sharing!
Small crashes in the S&P500 which coincide with deep breadth collapse (e.g. examples 1, 4, 11 in your beautifully annotated visual) are often followed by a deeper crash. Money first chases a few stocks in search of returns, then leaves stocks altogether.
1
1
9
Thanks for sharing. Two questions:
1. Average % gain how many months later?
2. What is the source of the data prior to 1997? FINRA publishes margin statistics since 1997 here: finra.org/rules-guidance/key…
82
If flow into cash-like ETFs is at an all-time high, why are cash allocations only at 13-14% (aaii.com/assetallocationsurv…)?
A 13-14% cash allocation is one of the lowest in history (bottom 1 percentile).
152