

Love Living, Family and Crypto : #headhunting #dunewizard #tradingview #musicNFTs #cryptoresearch #sats
Blockchain
Joined June 2009
- Tweets4.9K
- Following4.6K
- Followers862
- Likes16K
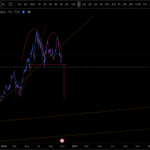

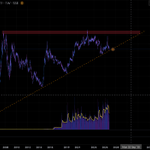

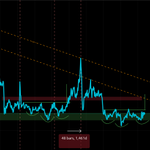


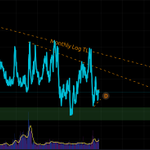
Kospi is painting both a bearish H&S and an inverted Cup and Handle
The problem is that similar setup can be seen in other Asian Markets like HK-Hanseng, JP-Nikkei.
Probably the real bear leader is the Chinese Stock Market where CSI300, Shanghai & Shenzhen already broke down


78
This is the most Bearish Chart for BTC
BTC Vs M2 painting a bearish H&S that could be very nasty
But opposite to it there is a bullish iH&S that wants to destroy the right shoulder of the first, and the long term log trendline favors this.

1
62
For those that want to have exposure to the Chinese market.
Comparing the HongKong (Hanseng - HSI1!) and Mainland ( CSI300 - 000300 )
If you do not know what to select, this is an absolutely good spot for choosing CSI and over HSI longterm
(unless there is a change of paradym)

32
The real Index of the Chinese Stock Market CSI300 is on the region where it normally bottoms Vs OIL and Vs RMB (chinese yuan)
Maybe some more sessions down and the uptrend will re-start (long term bullish triangle)
Unless is a change of paradym, which hopefully is not the case


32
USOIL Vs USM2 is pating an iH&S similar to that of the 90's
At that time it took 4Y to peak from the break out moment.
(same history for UKOIL)

48


I would argue that NG1!
Is bullish on the midterm (next few months)
Vs SPX (also bullish short term)
Vs USOIL (though could be bearish short term)
Bullish on the short term (days to weeks)
Vs Crypto
Natural Gas seems to be bullish overall


50
DJI has been trending down, while SPX makes ATHs, making a new relative ATLs DJI/SPX
DJI Vs Gold is painting an iH&S
Maybe is time to be bullish on DJI at least for a while on GOLD and likely USD terms


2
76


In the Year 2000
The Top for SPX was very near to the point of when the Brazilian Stock Market IBOV started performing better to than the Nasdaq.
That point might be repeating again.
(notice similar thing for gold)
New NDQ ATHs against them will extend the run even further


58
The CSI-300 Index has been underperforming the Nasdaq-100 for years.
There is an Index that offers some hope for Chinese Investors
The CSI Top Technology Index SSE:931087 could potentially lead the Chinese Stock Market
But it has to hold the trendline and then outperform.


41
The biggest Cup and Handle I have seen, dates since 1904 and is breaking out
@TonySeverinoCMT who posted the inverted version of this chart, made me realize of its existance
He sees it as an ultra very sign, I am still not sure
The clear message: forget the DJI, is better SPX

2
5
691
Tony sees it as an ultra *bearish sign.
You guys @badcharts1 @NorthstarCharts
@rationaletrade that like to look at long history charts might like this one, and I would love your feedback on how bullish or bearish you see this for the risk on markets
1
1
108
MigueFinance 🇻🇪 retweeted

It’s not China they fear.
It’s what China disproves.
That a nation can rise without plunder.
That poverty can fall without war.
That growth doesn’t need Wall Street permission slips.
That a billion people can be fed, housed, and educated without invading anyone.
That is what terrifies the empire.
Not tyranny.
But competence.
Indeed CQQQ helped to Identify the BTC Top in Oct 2025!
Sadly I did not even give it the weight it diserved and forgot at the time 😳🔫
Also historically is treding up or starting to trend up on or after a BTC bottom
But now is not doing it yet
So is the bottom not in then?
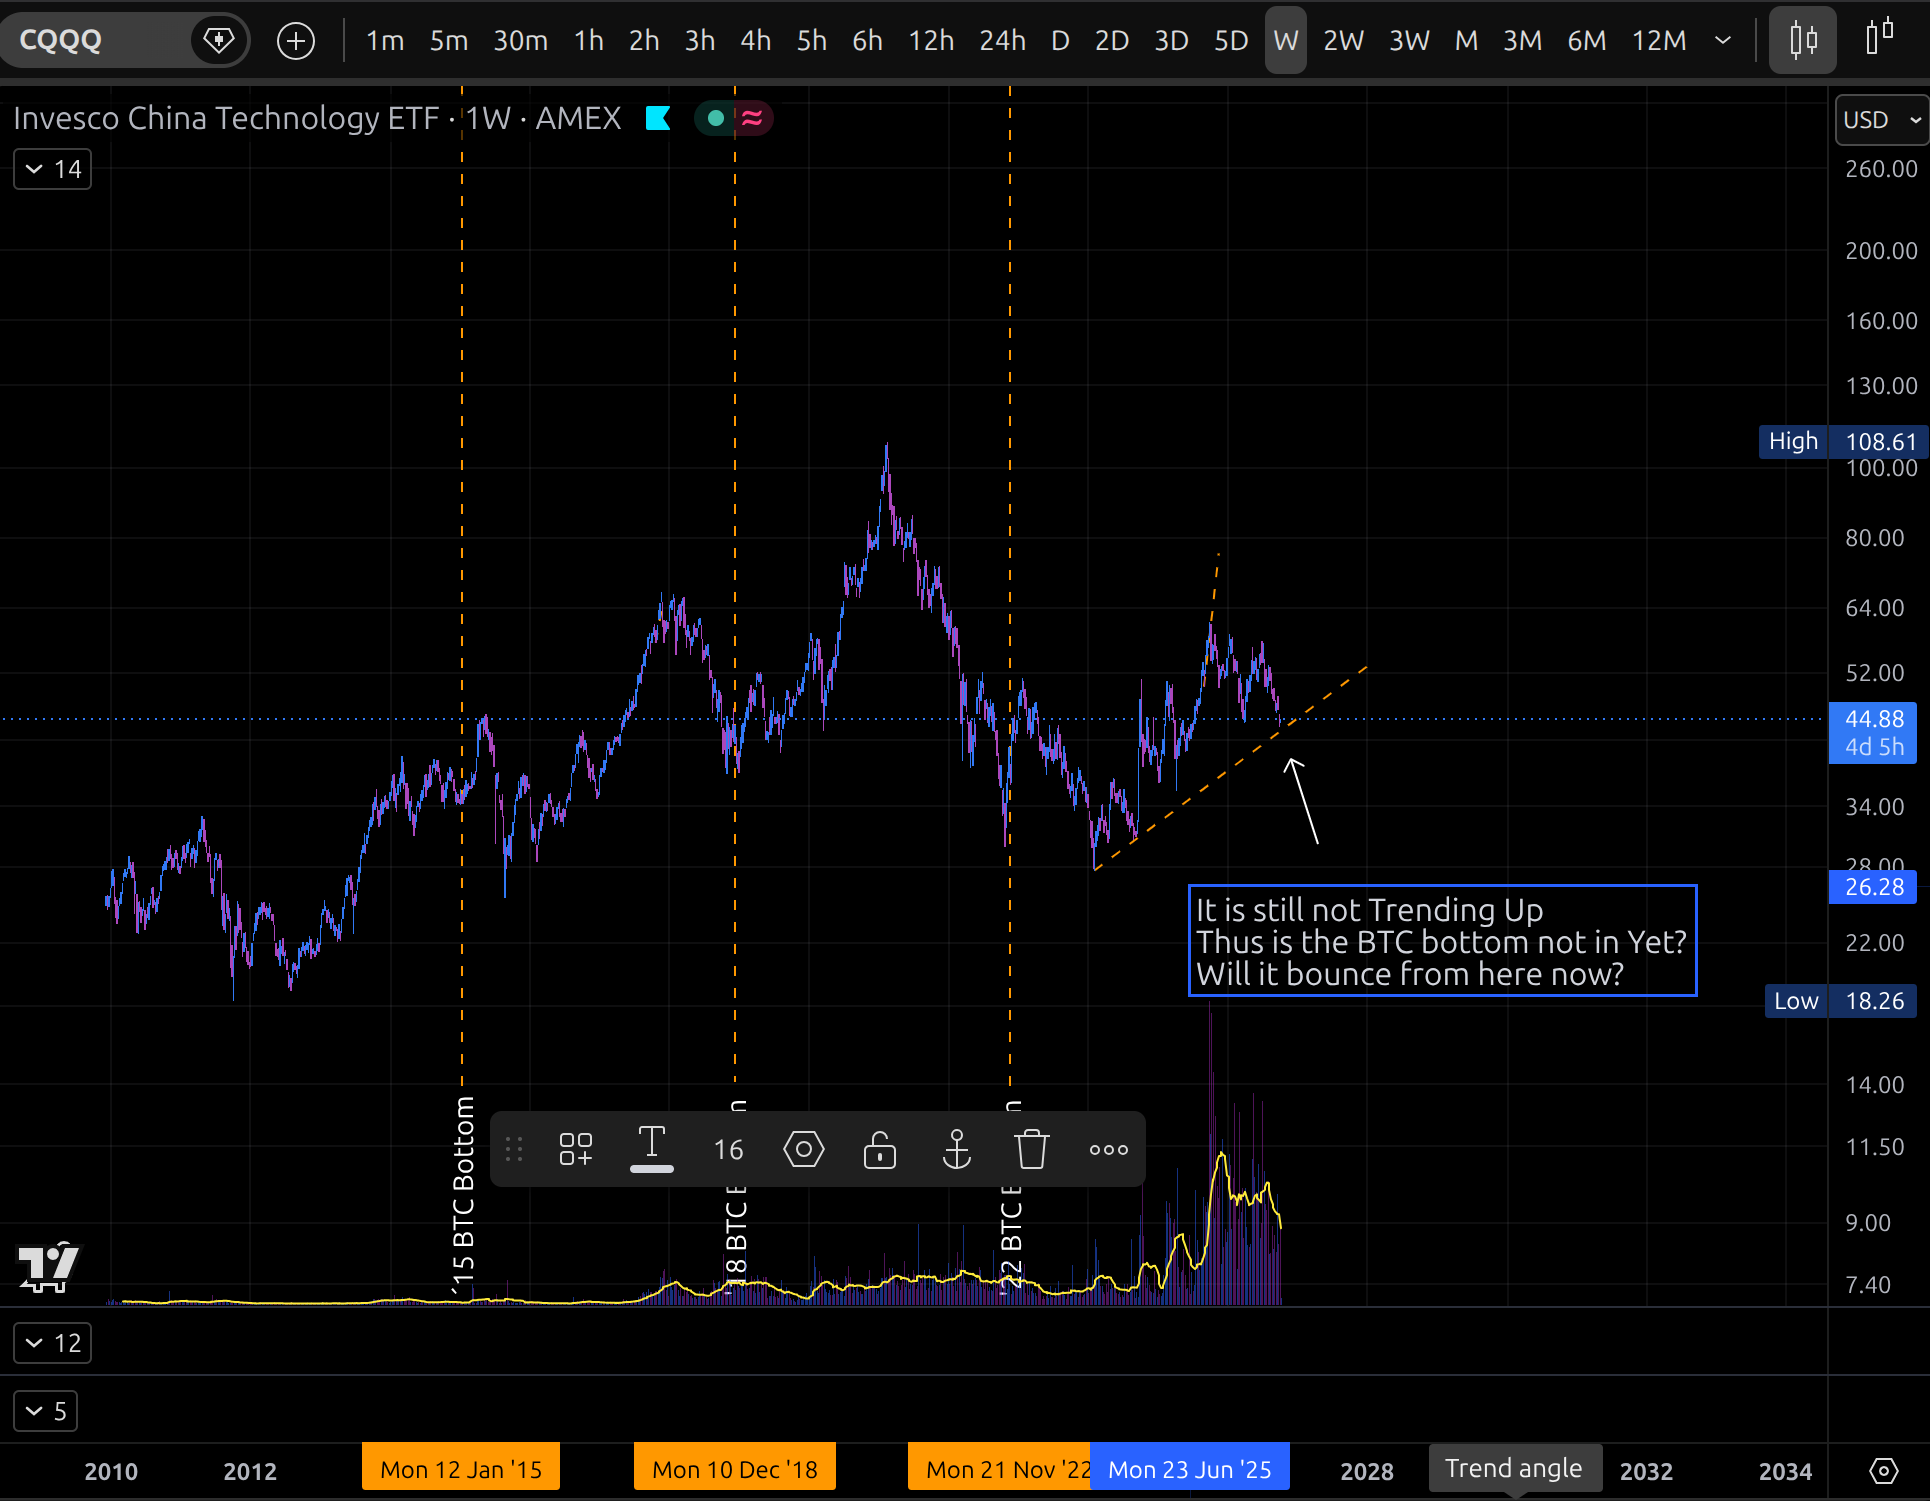
CQQQ is breaking down from its current Main Log TL
If the present rhymes with the past
If it keeps bellow and does not recover then on the next days (or few weeks) we will get a new ATH for BTC
And that would be it
Alts could then again top potentially a bit later than BTC

55
SPX Vs Gold (XAU) is painting a bullish Inverse H&S
Which could potentially lead SPX to its 2026 ATH and/or Gold to its 2026 Bottom
On the longer timeframe also notice that SPX is already desceding Vs Gold so this could also lead to a Kiss of Death for SPX


36
Altcoins have been so weak for the 5 years that is difficult to believe
But the chart is pointing to a possible breakout like on Feb'21 !
Could it be possible?
Part of me wants to be bearish, ngl, but this seems like a good opportunity
TOTAL3ES/BTC suggests the same


1
1
53
Silver Vs Oil chart seem to have been trading on same range during a lifetime
That can help to identify tops for Silver and Oil
USOIL at this time is much much less riskier than Silver XAU

