

eHoldings Intelligence | TA/Charts | Position Trader//Investor | Bitcoin Monthly Price Action Report | *my tweets are not investment advice.*
Joined September 2011
- Tweets36.4K
- Following887
- Followers2.2K
- Likes102K




Ethereum continues to be a solution looking for non existing market problem. 😬

ETH is never going to be SOV because its entire existence rests on it continuing to be the most widely adopted blockchain for smart contracts (don’t @ me) and that’s not guaranteed even if it is likely
Just accept it’s a fee burning token that doesn’t have to go up
97


In many ways, our current system of governance & democracy has become a litmus test of entropy...
insofar as how much disorder & chaos can it yield before fundamental principals reorder society, again?
62


GM...please find below, The Bitcoin Monthly Price Action Update for October. 🙏
"Bitcoin's price has thus far held up relatively well all things considered. Its moves as of late appear to be measured & calm yet only in the next bull's market hindsight will we be able to reflect back on just how instrumental this price action was."
THE BITCOIN MONTHLY
Price Action Update For Oct./2026
Closing Price- $77,430
S/T Daily Chart-Bullish:
Reading unchanged from Sept.
While still bullish, October's daily price action appears to be influenced by a potential pattern developing on the longer time frames— weekly & monthly.
Albeit the move down in Oct. was nothing out of the ordinary & relatively mild...
BTC's price currently sits back down at the 200 day EMA & I'm expecting it to break to the downside if the larger yet more meaningful pattern is to take shape.
M/T Weekly Chart-Neutral:
Reading unchanged from Sept.
October's weekly price action saw nothing but red, ~4 consequitve down weeks.
But as I've said, I believe this move is potentially to fulfill a more meaningful pattern— H&S bottom.
Given BTC's high last month, I had to adjust the neckline (resistance) to upward slanting, although this still qualify's nonetheless.
BTC's price has now traded back down to the 40W EMA on the weekly, and expect it to break downward somewhat in forseeable future...
yet I still read this timeframe's price action as neutral because of what I wrote about in regards to this topic in last month's report.
L/T Monthly Chart-Neutral:
Reading unchanged from Sept.
Performance for the month was, -7.34%.
Albeit a small step, the monthly price action is potentially looking to fulfill a larger & more meaningful bottom which would be quite constructive in my opinion.
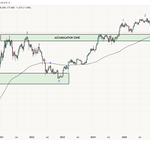
Suffice to say I expect Bitcoin's price to trade back down to top of accumulation zone. I'm willing to admit this is wishful forecasting on my part.
Final Note:
I suspect most of you follow markets & geopolitics. And given their current status, whether it's the precariousness of what has developed with AI or its market dynamics, or tensions from several ongoing wars, state of politics & tradewars...
Bitcoin's price has thus far held up relatively well all things considered. Its moves as of late appear to be measured & calm yet only in the next bull's market hindsight will we be able to reflect back on just how instrumental this price action was.
My Mode of Action: HOLD (default for core position based on presupposition outlined below).
DCA purchases are in full force as per previous reports & will continue until further notice.
As always, thank you for reading & I remain with friendly greetings. 🙏
S/T = Short Term= <3 months
M/T= Medium Term= 3 months> 1 year
L/T = Long Term= > 1 year
**Mode of Action** is presupposed on the assumption that Bitcoin will appreciate in value over the foreseeable future, thereby having you hold an allocation indefinitely.
There may be rare periods where a sell opinion is shared, although that is not meant to necessarily apply to 100%, if any, of my allocation. Position sizing is always according to your own level of risk tolerance & comfort level.
The goal for my reports is to provide a frame of reference as per Bitcoin's current market trend in an effort to maximize positioning thereby improving my average cost basis.
My Bitcoin monthly reports are not to be construed as investment advice; they're for information purposes only.


1
1
154
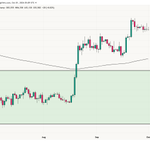
These are the interim key BTC levels I'm currently watching.
We set ATH close on weekly basis via b/o ~2 weeks ago therefore currently retesting that area which is now support.
On daily, the low of Mar.05 of ~$59.3k is of note.
The monthly will also be determined in 12 days, which may indicate a slightly deeper correction.
Thus far, I don't see the price action indicate anything outside of normal corrective move.
Ultimately, we'll see how the weekly finishes up, holding $65.5k levels would be constructive.
Will update accordingly.


1
4
2,228
THE BITCOIN MONTHLY
Price Action Update For Sept./2026
Closing Price- $83,563
S/T Daily Chart-Bullish:
Reading unchanged from August.
Bullish momentum on the daily continued in September, although price action has been consolidating over the past week or so.
Initially, we were expecting resistance at the ~$83K levels— which is marked by the neckline of a potential H&S pattern developing on the weekly & monthly...
although bulls>momentum propelled BTC's price up to~$87,300 in Sept., prior to it now settling closer to weekly resistance at ~$83K levels.
M/T Weekly Chart-Neutral:
Reading unchanged from August.
Sept. weekly price action was positive yet we remain at a neutral reading because of what I believe is still developing.
As indicated on past report, I'd like to see price action clear the 40W EMA via space & time, so not there quite yet.
I'd also like to see what comes of this potential H&S prior to settling on an improved reading.
As you will note, I adjusted the neckline/resistance level with a slight upslope compared to prior month because of daily price action taking BTC to ~$87K levels— pattern is still every much in tact despite.
L/T Monthly Chart-Neutral:
Reading unchanged from August.
Performance for the month was, +6.35%.
Albeit mild, the monthly price action had positive follow through from Aug.'s monthly gain. As indicated, price action is currently consolidating prior to what I believe will only be an interim directional move.
Question that remains is to where? Negate H&S pattern developing because momentum is too strong therefore taking price upwards...
or does a more structured & patient bottom continue to take shape with a retest of ~$65K area?
Time will tell.
Final Note:
In last report I wrote...
Aug.'s price action potentially marked a pivot in bias on the weekly & if successful, will likely change the state of the montly chart also.
It has not as of yet.
What I'm currently seeing in Bitcoin's chart is, although daily price action has had a bullish reading over past 2 reports, a fundamental shift on longer time frames still remains indecisive.
As we enter the 4th Q of the year, I suspect this will change & more clarity on Bitcoin's secular trend will emerge.
My Mode of Action: HOLD (default for core position based on presupposition outlined below).
DCA purchases are in full force as per previous reports & will continue until further notice.
As always, thank you for reading & I remain with friendly greetings. 🙏
S/T = Short Term= <3 months
M/T= Medium Term= 3 months> 1 year
L/T = Long Term= > 1 year
**Mode of Action** is presupposed on the assumption that Bitcoin will appreciate in value over the foreseeable future, thereby having you hold an allocation indefinitely.
There may be rare periods where a sell opinion is advised, although that is not meant to apply to 100%, if any, of your allocation. Position sizing is always according to your own level of risk tolerance & comfort level.
The goal for my reports is to provide a frame of reference as per Bitcoin's current market trend in an effort to maximize positioning thereby improving my average cost basis.
My Bitcoin monthly reports are not to be construed as investment advice; they're for information purposes only.


THE BITCOIN MONTHLY
Price Action Update For Oct./2026
Closing Price- $77,430
S/T Daily Chart-Bullish:
Reading unchanged from Sept.
While still bullish, October's daily price action appears to be influenced by a potential pattern developing on the longer time frames— weekly & monthly.
Albeit the move down in Oct. was nothing out of the ordinary & relatively mild...
BTC's price currently sits back down at the 200 day EMA & I'm expecting it to break to the downside if the larger yet more meaningful pattern is to take shape.
M/T Weekly Chart-Neutral:
Reading unchanged from Sept.
October's weekly price action saw nothing but red, ~4 consequitve down weeks.
But as I've said, I believe this move is potentially to fulfill a more meaningful pattern— H&S bottom.
Given BTC's high last month, I had to adjust the neckline (resistance) to upward slanting, although this still qualify's nonetheless.
BTC's price has now traded back down to the 40W EMA on the weekly, and expect it to break downward somewhat in forseeable future...
yet I still read this timeframe's price action as neutral because of what I wrote about in regards to this topic in last month's report.
L/T Monthly Chart-Neutral:
Reading unchanged from Sept.
Performance for the month was, -7.34%.
Albeit a small step, the monthly price action is potentially looking to fulfill a larger & more meaningful bottom which would be quite constructive in my opinion.
Suffice to say I expect Bitcoin's price to trade back down to top of accumulation zone. I'm willing to admit this is wishful forecasting on my part.
Final Note:
I suspect most of you follow markets & geopolitics. And given their current status, whether it's the precariousness of what has developed with AI or its market dynamics, or tensions from several ongoing wars, state of politics & tradewars...
Bitcoin's price has thus far held up relatively well all things considered. Its moves as of late appear to be measured & calm yet only in the next bull's market hindsight will we be able to reflect back on just how instrumental this price action was.
My Mode of Action: HOLD (default for core position based on presupposition outlined below).
DCA purchases are in full force as per previous reports & will continue until further notice.
As always, thank you for reading & I remain with friendly greetings. 🙏
S/T = Short Term= <3 months
M/T= Medium Term= 3 months> 1 year
L/T = Long Term= > 1 year
**Mode of Action** is presupposed on the assumption that Bitcoin will appreciate in value over the foreseeable future, thereby having you hold an allocation indefinitely.
There may be rare periods where a sell opinion is shared, although that is not meant to necessarily apply to 100%, if any, of my allocation. Position sizing is always according to your own level of risk tolerance & comfort level.
The goal for my reports is to provide a frame of reference as per Bitcoin's current market trend in an effort to maximize positioning thereby improving my average cost basis.
My Bitcoin monthly reports are not to be construed as investment advice; they're for information purposes only.
Like fiat currency, I believe central banks are destined to be replaced by better ideas—technologies primarily.

Macklem’s Incompetence: Fighting the 1970s, Punishing Canada Today
The Bank of Canada is hiking into a negative growth shock because it fears an inflation problem its own underlying data do not establish. This is not prudent risk management. It is incompetence dressed up as vigilance.
Trimmed CPI inflation is 1.8% and declining. Employment is contracting. Even the Bank’s own statement puts inflation excluding gasoline at 2.2%, core inflation close to target, and longer-term inflation expectations firmly anchored. It acknowledges excess supply and expects new American tariffs to slow growth. Yet Macklem is raising rates because higher energy costs might eventually spread through the economy.
The distinction matters. Higher oil prices squeeze purchasing power; tariffs impair production and trade. Higher interest rates cannot fix either problem. They can, however, compound the damage by weakening spending, housing and investment. Macklem is responding to an external cost shock by imposing an additional domestic demand shock.
Second- and third-round inflation effects are risks to assess, not facts to assume!!! With underlying inflation subdued, jobs contracting and expectations anchored, the burden of proof lies with the central bank proposing to tighten. Its statement does not meet that burden.
Macklem increasingly resembles a Davos technocrat intellectually trapped in the 1970s: invoking the dangers of an inflationary spiral while discounting the weakness in front of him. The spectre of that decade has become a substitute for judgment.
His incompetence lies in that misdiagnosis. Hiking into a negative growth shocks leads to an avoidable recession.
He is making Canadians pay higher borrowing costs today to insure against inflationary spillovers that have not yet materialized broadly in the data.
A central bank should respond to evidence, not force today’s economy into yesterday’s cautionary tale.
Yes it’s true: Tiff Macklem is worse than John Crow. The worst governor of the Bank of Canada in modern history.
73
While each participant should proportion according to own goals, needs & tolerance for risk— I believe holding a mix of all three will continue to be best form of savings in forseeable future.

55
Please find below, The Bitcoin Monthly Price Action Update for September. 🙏
"What I'm currently seeing in Bitcoin's chart is, although daily price action has had a bullish reading over past 2 reports, a fundamental shift on longer time frames still remains indecisive.
As we enter the 4th Q of the year, I suspect this will change & more clarity on Bitcoin's secular trend will emerge."
THE BITCOIN MONTHLY
Price Action Update For Sept./2026
Closing Price- $83,563
S/T Daily Chart-Bullish:
Reading unchanged from August.
Bullish momentum on the daily continued in September, although price action has been consolidating over the past week or so.
Initially, we were expecting resistance at the ~$83K levels— which is marked by the neckline of a potential H&S pattern developing on the weekly & monthly...
although bulls>momentum propelled BTC's price up to~$87,300 in Sept., prior to it now settling closer to weekly resistance at ~$83K levels.
M/T Weekly Chart-Neutral:
Reading unchanged from August.
Sept. weekly price action was positive yet we remain at a neutral reading because of what I believe is still developing.
As indicated on past report, I'd like to see price action clear the 40W EMA via space & time, so not there quite yet.
I'd also like to see what comes of this potential H&S prior to settling on an improved reading.
As you will note, I adjusted the neckline/resistance level with a slight upslope compared to prior month because of daily price action taking BTC to ~$87K levels— pattern is still every much in tact despite.
L/T Monthly Chart-Neutral:
Reading unchanged from August.
Performance for the month was, +6.35%.
Albeit mild, the monthly price action had positive follow through from Aug.'s monthly gain. As indicated, price action is currently consolidating prior to what I believe will only be an interim directional move.
Question that remains is to where? Negate H&S pattern developing because momentum is too strong therefore taking price upwards...
or does a more structured & patient bottom continue to take shape with a retest of ~$65K area?
Time will tell.
Final Note:
In last report I wrote...
Aug.'s price action potentially marked a pivot in bias on the weekly & if successful, will likely change the state of the montly chart also.
It has not as of yet.
What I'm currently seeing in Bitcoin's chart is, although daily price action has had a bullish reading over past 2 reports, a fundamental shift on longer time frames still remains indecisive.
As we enter the 4th Q of the year, I suspect this will change & more clarity on Bitcoin's secular trend will emerge.
My Mode of Action: HOLD (default for core position based on presupposition outlined below).
DCA purchases are in full force as per previous reports & will continue until further notice.
As always, thank you for reading & I remain with friendly greetings. 🙏
S/T = Short Term= <3 months
M/T= Medium Term= 3 months> 1 year
L/T = Long Term= > 1 year
**Mode of Action** is presupposed on the assumption that Bitcoin will appreciate in value over the foreseeable future, thereby having you hold an allocation indefinitely.
There may be rare periods where a sell opinion is advised, although that is not meant to apply to 100%, if any, of your allocation. Position sizing is always according to your own level of risk tolerance & comfort level.
The goal for my reports is to provide a frame of reference as per Bitcoin's current market trend in an effort to maximize positioning thereby improving my average cost basis.
My Bitcoin monthly reports are not to be construed as investment advice; they're for information purposes only.


The U.S. Dollar Index (DXY) first appeared on the charts back in 1973.
Its strongest rally came in 1985, when the greenback rose to ATH's against its basket of peers- a level it has never again approached.
After that peak, the dollar slid more than half its value, bottoming out at ~71 in 2008.
Since then the DXY has been on a steady uptrend, marking the longest upward stretch it’s seen since inception of the index.
Yet, despite the recent rise, the index is still technically in a long‑term downtrend that began after the 1985 high.. each new peak has been lower than the last.
Now the index finds itself at a crossroads.
It’s testing the lower boundary of the roughly 15‑year uptrend that has carried it forward, while also coming off its 2022 highs that were just shy of the 2001 peak.
In other words, the DXY could be carving out a new, lower high- perhaps suggesting that the broader secular decline may still be in play....
Or, while the dollar could still be grinding lower, the path of least resistance may actually be found right here, in lower‑range support of its 15‑year up‑channel (see chart below).
That zone could serve as a springboard, allowing the DXY to resume a slow, steady climb back toward its historic ATH?
In my view, I believe the DXY>USD strengthens from here therefore I’m firmly bullish- my position is long on the DXY.

Markets don't need another ETF or passive index strategy... it instead needs the active investing renaissance that is attempting to garner momentum to accelerate.

This is one of the WEAKEST US equity markets in history:
Only ~29% of the S&P 500's companies have outperformed the index over the last 3 years.
This is near the lowest reading since the 2000 Dot-Com Bubble peak, when this figure fell to ~25%.
The market has almost never been this concentrated.

2
143
Whether Bitcoin reaches this target isn't as important as the fact that it continues to accrue real value well into the future, consistently outpacing inflation by significant margins.

Bitcoin’s power law math continues to suggest that a new cyclical bull market is underway after holding $60k, targeting $300k in 2029.

2
201