
The Foundation for Stroke Prevention. Steven Rudolph, MD, Director
- Tweets1.1K
- Following108
- Followers3.9K
- Likes1



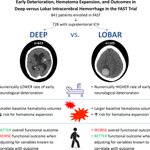


ALT Graphic abstract in Lin and Cramer.


ALT Figure 1. Recommended lifestyle behaviors and evidence grades from the 2024 American Heart Association/American Stroke Association stroke prevention guideline; healthy sleep guidance from the American Heart Association Life’s Essential 8.1,2

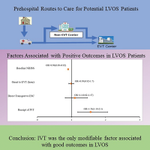
ALT Graphic abstract in Pitchan Velammal et al.


ALT Figure in Foschi and D’Anna et al.




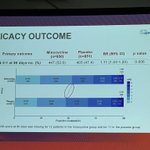
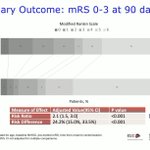
ALT Bar graph showing the percentage of patients on the Modified Rankin Scale, comparing "EVT plus Medical Management" (N=144) and "Medical Management Alone" (N=156). Scores range from 0 to 6. The distribution is labeled with percentages and number of patients for each category.

ALT A forest plot comparing EVT plus Medical Management to Medical Management Alone for various subgroups, showing adjusted odds ratios and confidence intervals. Subgroups include age, sex, time from onset to randomization, site of occlusion, cause of stroke, baseline NIHSS score, intravenous thrombolysis, and perfusion-mismatch volume.

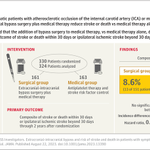
ALT Bar graph showing the percentage of patients on the Modified Rankin Scale, comparing "Intervention" (N=167) and "Control" (N=167). Scores range from 0 to 6. The distribution is labeled with percentages for each category.

ALT This image shows a forest plot comparing the intervention and control groups. Subgroups include age, time from onset to randomization, and type of stroke. Hazard ratios with 95% confidence intervals are displayed, indicating whether the intervention or control is better for a primary outcome.


![A graph from the Original Article “Retatrutide Once Weekly for Treatment of Obstructive Sleep Apnea.” The names of the two trials, TRIUMPH-1-OSA and TRIUMPH-2-OSA, are in parentheses after the title. The graph] shows the change in AHI among participants in TRIUMPH-1-OSA. The trial results are being presented at the European Sleep Research Society 2026 Congress. The logo of the New England Journal of Medicine is at the bottom.](https://pbs.twimg.com/media/HVIgx-QXsAAXxRZ.jpg?name=orig)
ALT A graph from the Original Article “Retatrutide Once Weekly for Treatment of Obstructive Sleep Apnea.” The names of the two trials, TRIUMPH-1-OSA and TRIUMPH-2-OSA, are in parentheses after the title. The graph] shows the change in AHI among participants in TRIUMPH-1-OSA. The trial results are being presented at the European Sleep Research Society 2026 Congress. The logo of the New England Journal of Medicine is at the bottom.




ALT This is a document titled "Health Literacy and Communication in Stroke Prevention, Management, and Recovery: A Scientific Statement From the American Heart Association."


