

Writings on wealth and happiness, investment ideas, some market commentary. Engineering PhD, MFE. #BeHappyBeWealthy
California, USA
Joined June 2024
- Tweets882
- Following78
- Followers200
- Likes180





Be Happy Be Wealthy retweeted

This week's report "The Coast Is Not Clear" explains why risk still lurks in the shadows. We may not have seen the end of this correction.
More in the replies below ...
marketsnextweek.substack.com…
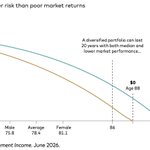
This chart captures the most common worry among retirees: "what if I outlive my money"?
Markets and longevity are both unpredictable. But such analysis assumes a fixed lifestyle. When their wealth declines, many retirees spend less which can help a lot.
theideafarm.com/wp-content/u…

1
19
Be Happy Be Wealthy retweeted
From our October 4 report:
"For stocks to go up, there must be buyers. The usual sources of equity demand look depleted, and they are not likely to be replenished soon. Therefore, in our view, US stocks are still vulnerable to a sharp correction."
Report linked below.

Investors are underestimating the fragility of the US stock market.
The latest weekly report is now available: marketsnextweek.substack.com…
Be Happy Be Wealthy retweeted
From the October 22 Report:
"""
There is a fundamental reason why we spend so much time looking at liquidity. Benjamin Graham, the author of The Intelligent Investor and a mentor to Warren Buffett, wrote:
"In the short run, the market is a voting machine, but in the long run, it is a weighing machine."
Here is what it means and how it relates to liquidity:
- In the long run, the prices of investments must reflect their valuation as determined by their long-term cash flows. These cash flows are decided by business fundamentals like revenue growth and profit margin. People who invest in businesses with strong fundamentals become wealthy because of the cash generated by these businesses. The valuations of such businesses eventually rise as more and more investors take note of their cash generation.
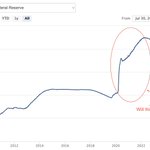
- In the short run, the price of any stock, regardless of underlying business quality, can rise rapidly. This happens when demand for the stock outstrips supply. This can happen to a single stock, a sector, an asset class, etc. When the effect is outsized, we use the term bubble to loosely describe the phenomenon. When the fundamentals (future cash flows) of a business become disconnected from its stock price, the price must eventually correct. But when is eventually? Eventually is when liquidity runs out. Unnatural extremes of valuation end when speculators can no longer secure funds to keep bidding up the prices of their favorite securities. This is why we watch liquidity closely. What we are seeing now is that liquidity is no longer growing. What remains is to ascertain whether the “Pause” button has been pressed on liquidity or the “Stop” button.
"""
The beginning of bearish fatigue?
The October 22 Markets Next Week report is now available.
marketsnextweek.substack.com…
Be Happy Be Wealthy retweeted
The October 15 report is out.
In a few words, new money is not entering stocks, and money that left smaller stocks to chase mega caps is now leaving the mega-caps. Some of it is going to other stocks; the rest may leave equities altogether. marketsnextweek.substack.com…

The fisherman looks happy.
The alcoholic looks a little blank, and a little defensive.
The millionaire looks secure, maybe a tad haughty.
The convict carries a chip on his shoulder.
PS: The photographer's interpretation, not mine.

In 2015, Canon asked 6 photographers to shoot the exact same man in the exact same setting.
Each photog was told a different story about who he was: a millionaire, a convict, an alcoholic, a fisherman, a lifesaver, or a psychic.
The portraits looked wildly different.
A reminder that what we see is often a result of what we already believe.


83
Be Happy Be Wealthy retweeted
The latest AAII Allocation Survey says that investors have just 13.3% of their portfolio in cash. This number falls in the bottom 1% of its history.
Here are other months when cash allocation was under 14%:
Mar '98
Dec '99
Nov '17-Jan '18
Jan '20
Jul-Aug '21
The common theme..
Be Happy Be Wealthy retweeted
We see indicators at levels that are normally seen near market bottoms. Yet, the S&P500 has been moving sideways. Are we at a bottom, or is the market going to crash?
The September 25 report examines the evidence:
marketsnextweek.substack.com…


Be Happy Be Wealthy retweeted
Indicators continue to paint a pretty bearish picture.
The September 18, 2026 Report is now available:
marketsnextweek.substack.com…
Be Happy Be Wealthy retweeted
Market participants are underestimating the risk of a correction in my opinion. Many indicators are flashing orange. Some are red. This week's report is linked in the reply.


Be Happy Be Wealthy retweeted
I introduce HysterMom: A Novel Investment Method with Superior Risk-Adjusted Returns
marketsnextweek.substack.com…

Three qualities to look for in an investment adviser
behappybewealthy.com/three-q…
46
Be Happy Be Wealthy retweeted
"At the end of long periods of rising stock values, large groups of people become euphoric and expect unreasonably high returns from stocks in the future. Similarly, after long periods of stock market stagnation, investors lose faith in stocks."
- The Aug 7 Report

Have I the courage to change?
World, I want to leave you better
I want my life to matter
I am afraid I have no purpose here
I watch the news on TV
Abandon myself daily
I am afraid to let you see the real me
- Sia
1
59
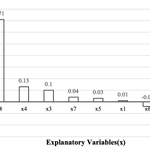
Some variables influence home values (data from California) more than others. Can you guess what is the variable x8 with the highest correlation? What about x2 with negative correlation?
For a hint, see my reply below. I will post the answer later.

Y being predicted is the Median Home Value.
The x variables (in random order) are:
- Housing Median Age
- Longitude
- Latitude
- Median Income
- Number of households in the block
- Population of the block
- Total Rooms
- Total Bedrooms
One of these really matters. Which one?
1
24
The answer is Median Income (x8). Median income is more positively correlated with home values than all other variables. This makes sense. Median income represents buying ability.
The negatively correlated variable is latitude. North Cali is cheaper.
pdfs.semanticscholar.org/86f…
7