

Bitcoin on-chain analytics (full node) Cryptography & Network Engineering, MA Computer Engineering, BS Run by Eric (@EvrClrx311).
- Tweets1.3K
- Following114
- Followers1.2K
- Likes2.4K


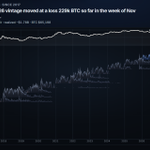




ALT Chart since 2013 of the share of all bitcoin above water (coins that last moved below the day’s close) versus underwater, as a 30-day average, with the BTC price overlaid on a log scale. Orange shading above the waterline, navy below. A marker on June 30, 2026 shows 54.5% underwater. On Nov 2, 2026, 59.4% of bitcoin is above water and 40.6% (8.16M BTC) is underwater at a $76.7k close.


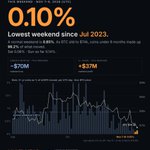
ALT Chart from over21million.com: share of all BTC moved that came from coins held 3+ years, each UTC weekend 2023–2026. Bars show the share; white line is BTC price. This weekend (Nov 7-8) is highlighted at 0.10%, the lowest share since July 2023. A dashed line marks the past-year normal of 0.85%. Bottom tiles: coins under 6 months were 99.2% of BTC moved and realized about $76M in losses; the 3+ year coins that moved were 798 BTC (0.10%) and realized about $39M in profit. Yellow arrows mark other low-share weekends; green arrows mark notable price rises.


ALT Infographic from @over21m, dark background with orange highlights. Headline: this weekend, November 7 and 8, 2026 (UTC, Sunday so far), coins held 3+ years were only 0.10% of all bitcoin that moved, the lowest weekend share since July 2023. A normal weekend is 0.85% (median of the past year). Saturday was 0.08% and Sunday so far 0.14%. As BTC slid to about $74k, coins under 6 months made up 99.2% of what moved and realized about $70 million in losses this weekend, while 3+ year coins that moved realized about $37 million in profit. A bar chart shows the daily 3+ year share since September 1 with a dashed normal-weekend line and the BTC price line falling to the right; the last two bars, November 7 and 8, are lit in orange and are the shortest. Change-adjusted on-chain data to block 975,103. Not a forecast. over21million.com