MD, Associate Professor @uktuebingen Radiologist, Cardiac Imaging Research Group Leader https://teapaw.org/t.co/Moys044JAP
- Tweets87
- Following1.1K
- Followers211
- Likes218






ALT Clinical findings at first presentation and histological findings in a punch biopsy of 4mm: Bilateral erythematous, slightly scaling plaques on elbows (A) and knees (B) in a 36-year-old patient with thymic carcinoma, without affection of mucous membranes, nail involvement or arthritis. Psoriasiform acanthosis with perivascular lymphocytic infiltration at the upper corium (C) (HE, bar 250µm). Magnified depiction of psoriasiform acanthosis with parakeratotic horn and prominent capillary vessels in the papillary dermis, furthermore collection of neutrophils in the stratum corneum (arrow) (HE stain, bar 50µm) (D).

ALT Radiological findings upon initial diagnosis of thymic carcinoma (A, B) Baseline hybrid PET/CT: (A) Axial contrast-enhanced CT scan demonstrates the large thymic carcinoma mass with sub-total collapse of main bronchi and superior vena cava syndrome (arrow). Influx of i.v. contrast agent applied in left cubital vein via muscular and thoracical veins (star). (B) Corresponding 18F FDG-PET fusion overlay indicates high metabolic activity of the tumor (yellow).

ALT A, B. Short-axis T2* map of a 42-year-old woman referred to CMR for clinical suspicion of non-ischemic cardiomyopathy who had incidental hepatic iron overload. (A) The T2* map allows assessment of both cardiac and hepatic T2* values by simply plotting a ROI. This patient shows decreased hepatic T2* values (mean 6.5 ms) indicating mild hepatic iron overload, (B) visualized by the dark red shaded liver in the colored map. C, D. Short-axis T2* map of a 32-year-old woman referred to CMR for clinical suspicion of myocarditis who had no iron overload. (C) This patient shows normal cardiac and hepatic T2* values, (D) as visualized by the green/orange shading of the heart and liver


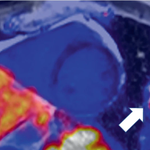
ALT MR images of a 68-year-old female with troponin-positive ischemic stroke and unobstructed coronary arteries. (A) LGE-negative, (B) increased T1 (1,074 ms), (C) increased T2 (52 ms), (D) increased ECV (30%) in an identical midventricular short-axis slice. (E) Cerebral volume perfusion CT at admission showed prolonged time-to-peak perfusion in the territory of the acute occluded left middle cerebral artery (red area).