Purushottam (he/him) retweeted
Have you ever wondered if phylogenetic trees could be represented continuously using real coordinates? Me too! doi.org/10.64898/2026.10.14.…
🧵 Our new paper is out in Physical Review Research!
Can destroying a signal make it easier to sense Surprisingly, yes! We show that ligand endocytosis can reshape extracellular chemical gradients and enhance directional information.
6/This suggests a new function for receptor endocytosis. A receptor is not simply reading an extracellular signal. By removing ligand, receptors can actively reshape the signal outside the cell before the cell reads it.
7/More broadly, cells may process information not only through intracellular signaling networks, but by modifying their extracellular environment. Sometimes, destroying a signal is part of the computation. Paper:
journals.aps.org/prresearch/…
Our paper on low dimensional max ent dynamics is out in Phys Rev E. We introduce Edwin. It compresses high-dimensional dynamics into a few latent variables and discovers symbolic equations for those variables:journals.aps.org/pre/abstrac…
Tested on 2D Brownian motion, Ornstein-Uhlenbeck, Smoluchowski self-assembly, spiking neural populations, low-rank RNNs, and one noisy experiment: aggregating RNA-liposome complexes, where it recovers a power-law exponent that maps onto known aggregation physics.
Purushottam (he/him) retweeted
New in PRX Life: microbial ecosystems are low-dimensional.
After studying about 200 gut microbiome datasets, the authors found that niche dimensionality was below predicted value, upending previous models.
Read the paper: go.aps.org/46qJqBa

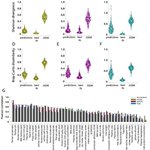
ALT Figure with three small scatter plots - a, b and c. Each of the three plots feature the niche dimensionality metric ηD on the X axis, along with a red dashed line and black dots. Plot A has “Environmental Dimensionality” on the Y axis and a positive correlation between the two variables. A label reads: R: 0.57 and P-value: 4.8e-3. Plot B has “Mean Metabolic Overlap” on the Y axis and shows a negative correlation between the two variables. The label reads R: -0.48 and P-value: 3.1e-11. Plot C has “Shannon Entropy” on the Y axis and shows a positive correlation between the two variables. The label reads R: 0.73 and P-value 1.89e-29.
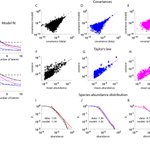
1/ Our new paper is out in PRX Life. Physicists often treat microbiomes as disordered systems with coexistence in very high-dimensional niche spaces. We asked whether empirical data supports this picture, and found the data point somewhere else: journals.aps.org/prxlife/abs…
6/ Why? Low dimensionality tracks metabolic competition and lower diversity, mirroring the "niche dimensionality hypothesis." Our simulations recover it only with correlated resource supplies plus metabolic tradeoffs. Dimensionality is lower in simplified diets and in disease.
7/ Encouragingly, others (e.g. @asanchez_lab) are also finding similar signatures of non-random interactions in microbiomes.