

Fighting against antisemitism and for the truth. Debunking misinformation about the Gaza war by doing investigations and evidence based journalism and reports.
Traveling around Europe
Joined August 2021
- Tweets7.1K
- Following605
- Followers3K
- Likes10.8K


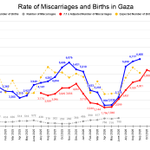




Did you know that births in Gaza, during the war and after, didn't not drastically fell like often portrayed like in the media these last couple of years? And did you know that the rate of miscarriages didn't rise to record levels, as also seen in the media.
It is false. The births has during the war followed seasonal trends and spikes during the war. In 2023 and 2024 the births were clearly higher than pre-war. During 2025 and so far 2026, the births has fallen by around the same amount as expected when 110,000 people had left Gaza until June 2024 and 150,000 until May 2025.
This does not happen in the direct affected war zone, in any other wars in the world. In relatively against pre war numbers, the births were higher and the miscarriages lower, than pre-war levels.

BIRTHS, EXPECTED BIRTHS AND MISCARRIAGES IN GAZA 2025-2026
I have here combined the number of births (blue) and miscarriages (grey) in Gaza January 2025 to September 2026, with the rate of expected births (yellow) and the pre-war adjusted number of miscarriages (red).
Miscarriages (red):
The adjusted number of miscarriages during the period (red) is based on the fact that in Gaza the rate of before the war was around 137-140 miscarriages per 1,000 live births, or 13.7-14%. That gives 100/14=7.1, which means that for each miscarriage around 7.1 live births occurred pre-war. This number is then multiplied to the rate of miscarriages and then adjusted 6 months forward in time, because most miscarriages occurs in the beginning of a pregnancy, not the end of one. This together gives a line that is comparable to the number of births we saw, with a overall clearly lower rate of miscarriages than occurred in 2025-2026 and that is the only period we have exact data of births and misscarrys, since the war began in October 2023.
Expected number of births (yellow):
The expected number of births (yellow) is based on the average of the seasonal fluctuation in birth numbers that can be seen in the only monthly pre-war Gaza MoH data available, from 2019, 2021 and 2022. This data clearly shows that the birth numbers where much lower in February to June during these year.
That is normal because February is the shortest month of the year and this period also follows nine months after the extremely warm summer months, where fewer people want to be "close to each other". In addition, these birth numbers where also adjusted monthly after the number of people leaving Gaza in this period, 110,000 until June 2024 and 150,000 until May 2025, in addition to the loss in population because of violent and natural deaths (only makes tiny differences).
What this means:
When these dips in births also occurred in February to June in 2025 and 2026, during the current conflict, Gaza MoH, the media, NGOs and the UN all has reported it as enormous fall in births that took place because of horrible life conditions in Gaza. But as seen, they has mostly followed the seasonal average and when more intents fighting took place, sometimes higher, sometimes lower but it is not showing any indications of horrible life conditions.
When it comes to miscarriages the rate has even been lower in comparison to what was expected. If it had followed the blue line it would have followed the pre-war average of miscarriages per live birth. Now it is clearly lower, meaning the rate has fallen.

Important context to the destruction of Gaza, in this thread. When the average was almost two destroyed structures per death, that clearly indicates that IDF didn't destroy to kill as many as possible. They destroyed for military objectives, to kill terrorist, to destroy weapons and the evacuations saved so many lives.
📊HOW MUCH OF GAZA WAS DESTROYED DURING THE WAR AND HOW MANY DEATHS/INJURIES OCCURRED AT THE SAME PERIOD OF TIME?
After two years of fighting, when the war ended on 10 October 2025, 123,464 structures out of Gazas 245,000 pre-war structures had been destroyed according to UN damage assessment. That is 50.4% of the structures that Gaza had before the war started.
As seen on the satellite images from Gaza, shared in my thread below, most of the destroyed areas are close to the Israeli border. And when it comes to the major cities in Gaza, except for Rafah, most of the city centers are still intact. 50.4% of structures destroyed, but that covers more of the smaller structures in Gaza than the larger inner city ones, according to satellite images from Gaza, and that is missed when looking at the overall destruction numbers.
But how did the destruction actually match the death toll and the injures?
I have matched the available UN damage assessments from 2023 (Oct and Nov), 2024 (Jan, Feb, Apr, May, July, Sep and Dec) and 2025 (Apr, July and Oct), with the number of deaths and injures at the same curve. This is seen in the two graphs below.
Note:
1. First, the damage assessments are most often from the end of the month. However, it not always 100% direct comparable at all times to the casualties.
2. Second, the boxes without a number in the upper graph are averages, based on the closest UN damage assessment before and after.
3. Third, the black number in the top are total numbers for all destroyed and damaged structures together, and the same for injuries and deaths, while the red numbers is the confirmed destroyed buildings and deaths.
4. The death toll includes is what Gaza MoH counts as violent deaths. However, they also includes accidents in that number. Of these violent deaths at least 3-4,000 are accidents.
What can be seen here?
The amount of destruction of course follows the casualties mostly pretty closely. The two first months had lower destruction in comparison to deaths, 21.4% vs 26.52%. In the end of January 2024, when 45.33% of the deaths had occurred, the destruction where at 39.6%. Then they followed closer the rest of the war.
Around 0.7 structures, that most often includes several or many housing units per structure, were damaged or destroyed per casualty (including both deaths and injures). 174,437 structures in comparison to 242,856 cautalites in total. At the same time, 122,464 structures were destroyed in comparison to 72,166 deaths in total, which is a rate of around 0.41 deaths per destroyed structure.
That is a very low ratio of deaths in comparison to how the rate of destruction was.
Several things are clear from this:
1. If Israel wanted to kill or injure as many Gazans as possible, the rate of casualties, and especially the rate of deaths, would have been much higher than the amount of destroyed structures. That is clear.
2. If Israel wanted to kill as many as possible, and also didn't have any related military objectives, they would have destroyed the inner cities of the larger cities in the Gaza Strip. Not just primarily the structures at the border to Egypt, that was used for smuggling, and the smaller structures that were closer to Israel and the structures in the outskirts of the largest cities, that indicates typical urban warfare patterns.
3. Israel has the capability to kill people if the wanted. The statistics show they didn't want to. The demographics of the death toll heavily indicates around 30,000 fighters dead.
4. Gaza already had huge problem with limited groundwater, over-usage and saltwater intrusion. Destroyed structures, and especially terror tunnels, will always make water supply harder. It is often portrayed as limited water supply is Israel's fault but it mostly comes from the fact that Gaza is a very small area, that is a desert, heavily over populated, where Hamas has used a large part of the civilian infrastructure for terror purposes.

War Detective retweeted

A review of the Airwars incident report shows how over time, based on Hamas & PIJ martyr notices, what was initially reported as "civilian only" turns out to have killed combatants, several commander level. I will bet this number goes to 10+ eventually. airwars.org/incidents/ispt00…

War Detective retweeted
BIRTHS, EXPECTED BIRTHS AND MISCARRIAGES IN GAZA 2025-2026
I have here combined the number of births (blue) and miscarriages (grey) in Gaza January 2025 to September 2026, with the rate of expected births (yellow) and the pre-war adjusted number of miscarriages (red).
Miscarriages (red):
The adjusted number of miscarriages during the period (red) is based on the fact that in Gaza the rate of before the war was around 137-140 miscarriages per 1,000 live births, or 13.7-14%. That gives 100/14=7.1, which means that for each miscarriage around 7.1 live births occurred pre-war. This number is then multiplied to the rate of miscarriages and then adjusted 6 months forward in time, because most miscarriages occurs in the beginning of a pregnancy, not the end of one. This together gives a line that is comparable to the number of births we saw, with a overall clearly lower rate of miscarriages than occurred in 2025-2026 and that is the only period we have exact data of births and misscarrys, since the war began in October 2023.
Expected number of births (yellow):
The expected number of births (yellow) is based on the average of the seasonal fluctuation in birth numbers that can be seen in the only monthly pre-war Gaza MoH data available, from 2019, 2021 and 2022. This data clearly shows that the birth numbers where much lower in February to June during these year.
That is normal because February is the shortest month of the year and this period also follows nine months after the extremely warm summer months, where fewer people want to be "close to each other". In addition, these birth numbers where also adjusted monthly after the number of people leaving Gaza in this period, 110,000 until June 2024 and 150,000 until May 2025, in addition to the loss in population because of violent and natural deaths (only makes tiny differences).
What this means:
When these dips in births also occurred in February to June in 2025 and 2026, during the current conflict, Gaza MoH, the media, NGOs and the UN all has reported it as enormous fall in births that took place because of horrible life conditions in Gaza. But as seen, they has mostly followed the seasonal average and when more intents fighting took place, sometimes higher, sometimes lower but it is not showing any indications of horrible life conditions.
When it comes to miscarriages the rate has even been lower in comparison to what was expected. If it had followed the blue line it would have followed the pre-war average of miscarriages per live birth. Now it is clearly lower, meaning the rate has fallen.
🚨THE RATE OF MISCARRIAGES IN GAZA WERE ACTUALLY LOWER IN 2025 AND 2026 IN COMPARISON TO PRE-WAR LEVELS
Pre-war the rate of miscarriages in Gaza were 140 per 1,000 births in 2022, or 14% of the total pregnancies. During the war we have heard over and over again that the miscarriages has been skyrocketing in Gaza, with claims of 460 miscarriages per 1,000 births, and that is one of the biggest arguments of the Genocide accusations against Israel and South Africa's Genocide ICJ case.
middleeasteye.net/news/war-c…
However, as everything else when it comes to what is said about the humanitarian situation in Gaza, that claim is not actually true. 14% miscarriages tells us that 7.1 times as many children were born in comparison to pregnancies that ended without a child that was born (100/14=7.1). If we apply the same rate of miscarriages from the pre-war 2022 number onto the miscarriages numbers from 2025 and 2026, we should then see much higher rate of miscarriages then in comparison to how many were pregnant at the time.
But we don't.
How to count:
The important detail about miscarriages is that they are generally happening in the first 1-3 months of the pregnancy, with an median of week 7-8. Therefore to compare the births during 2025-2026 with miscarriages during the correct period we need to adjust both the period of the miscarries forward 7 months to match the period and multiply the numbers with 7.1 to see if the rates match.
What we see:
When doing that, as the image below shows, the adjusted miscarriages number is lower than the birth numbers where 7 months after the miscarriages happened, when adjusting for the same rate of miscarriages as pre-war 2022 average of 14% miscarriages per birth.
The months with the lowest birth rate were April and May 2026, with around 2,000 births both months. But nowhere did the rate ever got close to the reported 460 miscarriages per 1,000 births. In April for an example, if the miscarriages were adjusted 7 months forward, the rate was still only 63 out of every 1,000 deaths.
So these reports of is not just false. This show the opposite.

WTF!? 😂

Me see big wall words from orange chief Trump.
Funny talk man Maher once help chief on show, become big. Now Maher mean, sweat when visit white cave, then lie on show. Maher numbers fall like dead mammoth. Chief numbers high. Maher spew fake about voters and cities. Maher loser, no more talk. Chief strong. Ugh.
Hi @X and @elonmusk. Is it allowed to mass manipulate images and news headlines like this account does, to use to fabricate false Grok answers? Non of these headlines exists and he has done at least ten posts like this these last 48 hours. All by hiding near transparent text in the corner of the image.
Here are first two examples, with the image and the transparent text in the corner pointed out:


Update: Now she has erased all earlier lies and stopped using this hidden text method. Instead she started to write things BBC actually has written about, with a text link, and blocked me so that I cannot answer anymore. All to spread the false narrative that the earlier posts also were true.

Explanation of the method:
xitter.cf/emarks123/status/21145…


War Detective retweeted

Un report, Euro-Med, Safsaf massacre 1948 and I don't know the other one. All watermarks on these fake headlines.


BIRTHS, EXPECTED BIRTHS AND MISCARRIAGES IN GAZA 2025-2026
I have here combined the number of births (blue) and miscarriages (grey) in Gaza January 2025 to September 2026, with the rate of expected births (yellow) and the pre-war adjusted number of miscarriages (red).
Miscarriages (red):
The adjusted number of miscarriages during the period (red) is based on the fact that in Gaza the rate of before the war was around 137-140 miscarriages per 1,000 live births, or 13.7-14%. That gives 100/14=7.1, which means that for each miscarriage around 7.1 live births occurred pre-war. This number is then multiplied to the rate of miscarriages and then adjusted 6 months forward in time, because most miscarriages occurs in the beginning of a pregnancy, not the end of one. This together gives a line that is comparable to the number of births we saw, with a overall clearly lower rate of miscarriages than occurred in 2025-2026 and that is the only period we have exact data of births and misscarrys, since the war began in October 2023.
Expected number of births (yellow):
The expected number of births (yellow) is based on the average of the seasonal fluctuation in birth numbers that can be seen in the only monthly pre-war Gaza MoH data available, from 2019, 2021 and 2022. This data clearly shows that the birth numbers where much lower in February to June during these year.
That is normal because February is the shortest month of the year and this period also follows nine months after the extremely warm summer months, where fewer people want to be "close to each other". In addition, these birth numbers where also adjusted monthly after the number of people leaving Gaza in this period, 110,000 until June 2024 and 150,000 until May 2025, in addition to the loss in population because of violent and natural deaths (only makes tiny differences).
What this means:
When these dips in births also occurred in February to June in 2025 and 2026, during the current conflict, Gaza MoH, the media, NGOs and the UN all has reported it as enormous fall in births that took place because of horrible life conditions in Gaza. But as seen, they has mostly followed the seasonal average and when more intents fighting took place, sometimes higher, sometimes lower but it is not showing any indications of horrible life conditions.
When it comes to miscarriages the rate has even been lower in comparison to what was expected. If it had followed the blue line it would have followed the pre-war average of miscarriages per live birth. Now it is clearly lower, meaning the rate has fallen.
🚨THE RATE OF MISCARRIAGES IN GAZA WERE ACTUALLY LOWER IN 2025 AND 2026 IN COMPARISON TO PRE-WAR LEVELS
Pre-war the rate of miscarriages in Gaza were 140 per 1,000 births in 2022, or 14% of the total pregnancies. During the war we have heard over and over again that the miscarriages has been skyrocketing in Gaza, with claims of 460 miscarriages per 1,000 births, and that is one of the biggest arguments of the Genocide accusations against Israel and South Africa's Genocide ICJ case.
middleeasteye.net/news/war-c…
However, as everything else when it comes to what is said about the humanitarian situation in Gaza, that claim is not actually true. 14% miscarriages tells us that 7.1 times as many children were born in comparison to pregnancies that ended without a child that was born (100/14=7.1). If we apply the same rate of miscarriages from the pre-war 2022 number onto the miscarriages numbers from 2025 and 2026, we should then see much higher rate of miscarriages then in comparison to how many were pregnant at the time.
But we don't.
How to count:
The important detail about miscarriages is that they are generally happening in the first 1-3 months of the pregnancy, with an median of week 7-8. Therefore to compare the births during 2025-2026 with miscarriages during the correct period we need to adjust both the period of the miscarries forward 7 months to match the period and multiply the numbers with 7.1 to see if the rates match.
What we see:
When doing that, as the image below shows, the adjusted miscarriages number is lower than the birth numbers where 7 months after the miscarriages happened, when adjusting for the same rate of miscarriages as pre-war 2022 average of 14% miscarriages per birth.
The months with the lowest birth rate were April and May 2026, with around 2,000 births both months. But nowhere did the rate ever got close to the reported 460 miscarriages per 1,000 births. In April for an example, if the miscarriages were adjusted 7 months forward, the rate was still only 63 out of every 1,000 deaths.
So these reports of is not just false. This show the opposite.
War Detective retweeted

Hey @Alonso_GD, was this one those "child execution" videos you "had to watch" and "traumatized you for life"?

War Detective retweeted

Extremely important page right now.
@FAAntisemitism - please follow
Too many left-wing and mainstream “feminists” were silent on the rape of Jewish women on October 7th
Sexual violence was used as a weapon of war by Palestinian terrorists and because the women were Jewish, the usual groups like @UN_Women were silent.
Of course the murders of Israelis becomes down played on Wikipedia.

On Wikipedia, two murdered Israelis become background.
Ron Roytman, 23, and Yuval Svilem, 20, were murdered Friday at Yehuda Junction.
By Saturday, an editor proposed redirecting the article to “2026 West Bank lockdown,” noting the lockdown affected “thousands of times more people than the initial shooting.”
Their murders become a footnote to the impact on Palestinians.
Sickening.

War Detective retweeted
📊HOW MUCH OF GAZA WAS DESTROYED DURING THE WAR AND HOW MANY DEATHS/INJURIES OCCURRED AT THE SAME PERIOD OF TIME?
After two years of fighting, when the war ended on 10 October 2025, 123,464 structures out of Gazas 245,000 pre-war structures had been destroyed according to UN damage assessment. That is 50.4% of the structures that Gaza had before the war started.
As seen on the satellite images from Gaza, shared in my thread below, most of the destroyed areas are close to the Israeli border. And when it comes to the major cities in Gaza, except for Rafah, most of the city centers are still intact. 50.4% of structures destroyed, but that covers more of the smaller structures in Gaza than the larger inner city ones, according to satellite images from Gaza, and that is missed when looking at the overall destruction numbers.
But how did the destruction actually match the death toll and the injures?
I have matched the available UN damage assessments from 2023 (Oct and Nov), 2024 (Jan, Feb, Apr, May, July, Sep and Dec) and 2025 (Apr, July and Oct), with the number of deaths and injures at the same curve. This is seen in the two graphs below.
Note:
1. First, the damage assessments are most often from the end of the month. However, it not always 100% direct comparable at all times to the casualties.
2. Second, the boxes without a number in the upper graph are averages, based on the closest UN damage assessment before and after.
3. Third, the black number in the top are total numbers for all destroyed and damaged structures together, and the same for injuries and deaths, while the red numbers is the confirmed destroyed buildings and deaths.
4. The death toll includes is what Gaza MoH counts as violent deaths. However, they also includes accidents in that number. Of these violent deaths at least 3-4,000 are accidents.
What can be seen here?
The amount of destruction of course follows the casualties mostly pretty closely. The two first months had lower destruction in comparison to deaths, 21.4% vs 26.52%. In the end of January 2024, when 45.33% of the deaths had occurred, the destruction where at 39.6%. Then they followed closer the rest of the war.
Around 0.7 structures, that most often includes several or many housing units per structure, were damaged or destroyed per casualty (including both deaths and injures). 174,437 structures in comparison to 242,856 cautalites in total. At the same time, 122,464 structures were destroyed in comparison to 72,166 deaths in total, which is a rate of around 0.41 deaths per destroyed structure.
That is a very low ratio of deaths in comparison to how the rate of destruction was.
Several things are clear from this:
1. If Israel wanted to kill or injure as many Gazans as possible, the rate of casualties, and especially the rate of deaths, would have been much higher than the amount of destroyed structures. That is clear.
2. If Israel wanted to kill as many as possible, and also didn't have any related military objectives, they would have destroyed the inner cities of the larger cities in the Gaza Strip. Not just primarily the structures at the border to Egypt, that was used for smuggling, and the smaller structures that were closer to Israel and the structures in the outskirts of the largest cities, that indicates typical urban warfare patterns.
3. Israel has the capability to kill people if the wanted. The statistics show they didn't want to. The demographics of the death toll heavily indicates around 30,000 fighters dead.
4. Gaza already had huge problem with limited groundwater, over-usage and saltwater intrusion. Destroyed structures, and especially terror tunnels, will always make water supply harder. It is often portrayed as limited water supply is Israel's fault but it mostly comes from the fact that Gaza is a very small area, that is a desert, heavily over populated, where Hamas has used a large part of the civilian infrastructure for terror purposes.
🧵1/5 Short thread about the Satellite Images of Gaza
There is much focus on the "new" Google Earth images from Gaza that people have just found about, even though the new ones came out already in may 2026.
However, when taking photos from a satellite of a desert area, with white buildings, in the middle of the summer, makes it so that all contrast goes away in the image and nothing is green. This sells the effect of most of it being rubble, even though it is not true.
Here are images from Sentinel-2 taken on 17 March 2026, showing the four areas of Gaza that is not Rafah. Images from December to March is when Gaza is mostly green. From April to November it looks like a desert (because it is).
sentinelbird.com/palestine/g…


🚨THE RATE OF MISCARRIAGES IN GAZA WERE ACTUALLY LOWER IN 2025 AND 2026 IN COMPARISON TO PRE-WAR LEVELS
Pre-war the rate of miscarriages in Gaza were 140 per 1,000 births in 2022, or 14% of the total pregnancies. During the war we have heard over and over again that the miscarriages has been skyrocketing in Gaza, with claims of 460 miscarriages per 1,000 births, and that is one of the biggest arguments of the Genocide accusations against Israel and South Africa's Genocide ICJ case.
middleeasteye.net/news/war-c…
However, as everything else when it comes to what is said about the humanitarian situation in Gaza, that claim is not actually true. 14% miscarriages tells us that 7.1 times as many children were born in comparison to pregnancies that ended without a child that was born (100/14=7.1). If we apply the same rate of miscarriages from the pre-war 2022 number onto the miscarriages numbers from 2025 and 2026, we should then see much higher rate of miscarriages then in comparison to how many were pregnant at the time.
But we don't.
How to count:
The important detail about miscarriages is that they are generally happening in the first 1-3 months of the pregnancy, with an median of week 7-8. Therefore to compare the births during 2025-2026 with miscarriages during the correct period we need to adjust both the period of the miscarries forward 7 months to match the period and multiply the numbers with 7.1 to see if the rates match.
What we see:
When doing that, as the image below shows, the adjusted miscarriages number is lower than the birth numbers where 7 months after the miscarriages happened, when adjusting for the same rate of miscarriages as pre-war 2022 average of 14% miscarriages per birth.
The months with the lowest birth rate were April and May 2026, with around 2,000 births both months. But nowhere did the rate ever got close to the reported 460 miscarriages per 1,000 births. In April for an example, if the miscarriages were adjusted 7 months forward, the rate was still only 63 out of every 1,000 deaths.
So these reports of is not just false. This show the opposite.
MORE GAZA POPULATION DATA SHOW THAT THE BIRTHS DURING THE WAR FOLLOWED THE EXPECTED MONTHLY NUMBER OF BIRTHS, MORE OR LESS THE ENTIRE WAR AND AFTER!
How has the birth numbers in Gaza changed monthly during the war, in comparison to the expected amount each month? To know this we have to look at pre-war birth numbers for each month to create a baseline, with seasonal fluctuations added (less babies born 9 months after the hot summer months, than during the rest of the year).
This presentation of the official data shows that the actual number of births were mostly following what is expected when actually accounting for the population loss during the period and how much the seasonal fluctuations in birth numbers, that follows nine months after the warm summer months.
How it is calculated follows...

Here is an updated version of the graph.
1. First of all as I noted above, I made a very tiny mathematical error in the other version, Google Sheets multiplied everything by 7 and then added 0.7 instead of multiplying everything by 7.1.
2. Second, I think it is better to make the comparison curve in the bottom to be not adjusted forward in time. Now they are when they took place instead of adjusted forward.
3. Third, when looking at the data from here I think that is more fitting for the Gaza data to move it 6 months forward instead of 7. Now it matches it perfectly and is likely how it compares to the real world, what took place in Gaza. Every locations has differences and there is nothing saying Gaza couldn't have the average miscarriages after 3 month of the pregnancy. Especially when they are calculating abortions in the same number.


War Detective retweeted

Great to meet Swedish MEP @alicemedce in Stockholm! Knew the situation in Europe is bad, but SHOCKED at the threat level to public figures who speak up for Israel. Please, Europeans, don’t let the Antizionist hate movement bully you out of supporting your friends & allies 🇮🇱🇸🇪🇪🇺

📊HOW MUCH OF GAZA WAS DESTROYED DURING THE WAR AND HOW MANY DEATHS/INJURIES OCCURRED AT THE SAME PERIOD OF TIME?
After two years of fighting, when the war ended on 10 October 2025, 123,464 structures out of Gazas 245,000 pre-war structures had been destroyed according to UN damage assessment. That is 50.4% of the structures that Gaza had before the war started.
As seen on the satellite images from Gaza, shared in my thread below, most of the destroyed areas are close to the Israeli border. And when it comes to the major cities in Gaza, except for Rafah, most of the city centers are still intact. 50.4% of structures destroyed, but that covers more of the smaller structures in Gaza than the larger inner city ones, according to satellite images from Gaza, and that is missed when looking at the overall destruction numbers.
But how did the destruction actually match the death toll and the injures?
I have matched the available UN damage assessments from 2023 (Oct and Nov), 2024 (Jan, Feb, Apr, May, July, Sep and Dec) and 2025 (Apr, July and Oct), with the number of deaths and injures at the same curve. This is seen in the two graphs below.
Note:
1. First, the damage assessments are most often from the end of the month. However, it not always 100% direct comparable at all times to the casualties.
2. Second, the boxes without a number in the upper graph are averages, based on the closest UN damage assessment before and after.
3. Third, the black number in the top are total numbers for all destroyed and damaged structures together, and the same for injuries and deaths, while the red numbers is the confirmed destroyed buildings and deaths.
4. The death toll includes is what Gaza MoH counts as violent deaths. However, they also includes accidents in that number. Of these violent deaths at least 3-4,000 are accidents.
What can be seen here?
The amount of destruction of course follows the casualties mostly pretty closely. The two first months had lower destruction in comparison to deaths, 21.4% vs 26.52%. In the end of January 2024, when 45.33% of the deaths had occurred, the destruction where at 39.6%. Then they followed closer the rest of the war.
Around 0.7 structures, that most often includes several or many housing units per structure, were damaged or destroyed per casualty (including both deaths and injures). 174,437 structures in comparison to 242,856 cautalites in total. At the same time, 122,464 structures were destroyed in comparison to 72,166 deaths in total, which is a rate of around 0.41 deaths per destroyed structure.
That is a very low ratio of deaths in comparison to how the rate of destruction was.
Several things are clear from this:
1. If Israel wanted to kill or injure as many Gazans as possible, the rate of casualties, and especially the rate of deaths, would have been much higher than the amount of destroyed structures. That is clear.
2. If Israel wanted to kill as many as possible, and also didn't have any related military objectives, they would have destroyed the inner cities of the larger cities in the Gaza Strip. Not just primarily the structures at the border to Egypt, that was used for smuggling, and the smaller structures that were closer to Israel and the structures in the outskirts of the largest cities, that indicates typical urban warfare patterns.
3. Israel has the capability to kill people if the wanted. The statistics show they didn't want to. The demographics of the death toll heavily indicates around 30,000 fighters dead.
4. Gaza already had huge problem with limited groundwater, over-usage and saltwater intrusion. Destroyed structures, and especially terror tunnels, will always make water supply harder. It is often portrayed as limited water supply is Israel's fault but it mostly comes from the fact that Gaza is a very small area, that is a desert, heavily over populated, where Hamas has used a large part of the civilian infrastructure for terror purposes.
🧵1/5 Short thread about the Satellite Images of Gaza
There is much focus on the "new" Google Earth images from Gaza that people have just found about, even though the new ones came out already in may 2026.
However, when taking photos from a satellite of a desert area, with white buildings, in the middle of the summer, makes it so that all contrast goes away in the image and nothing is green. This sells the effect of most of it being rubble, even though it is not true.
Here are images from Sentinel-2 taken on 17 March 2026, showing the four areas of Gaza that is not Rafah. Images from December to March is when Gaza is mostly green. From April to November it looks like a desert (because it is).
sentinelbird.com/palestine/g…
PERCENTAGE OF DESTRUCTION & SOURCES
Below is a graph that shows the % of the destruction, in comparison to the final October 2025 amount.
UN damage assessments:
Oct 2023: unosat.org/products/3714
Nov 2023: unosat.org/products/3769
Jan 2024: unitar.org/about/news-storie…
Feb 2024: unosat.org/products/3804
Apr 2024: unosat.org/products/3824
May 2024: un.org/unispal/document/unos…
July 2024: unosat.org/products/3904
Sep 2024: unosat.org/products/3984
Dec 2024: unosat.org/products/4047
Apr 2025: unosat.org/products/4130
Aug 2025: unosat.org/products/4165
Oct 2025: un.org/unispal/document/unos…
June 2026 (extra): ochaopt.org/content/humanita…
Others:
Deaths and Injuries: sehatty.ps
Satellite comparisons (lower quality): sentinelbird.com/palestine/g…
Quality details (haven't updated all of Gaza): earth.google.com/web/
