
Data scientist at Reliant Medical Group @Optum
- Tweets492
- Following252
- Followers701
- Likes38










ALT Chart shows potential deaths due to COVID during the delta and omicron waves compared to the relatively few deaths that actually happened in NYC, attributable to vaccination. Text reads: Saving lives: lower death rates. COVID-19 in NYC: actual 7-day average death rates vs. modeled (without vaccines) from October 2020 to February 2022.

ALT LinkedIn post from Bill Gates reads, The pandemic isn’t over, and the world has more work to do—but it’s worth taking a moment to celebrate the lives that have been saved. Link preview reads The extraordinary success of Covid-19 vaccines, in two charts vox.com and shows graph of projected COVID deaths with and without vaccinations. There would have been a huge surge of deaths Aug-Oct without vaccinations.

ALT Yale School of Public Health faculty and staff headshots: A. David Paltiel, Alison Galvani, Jason Schwartz and Pratha Sah.


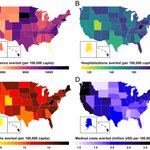
ALT Figure shows difference in COVID-19 hospitalizations and deaths between status quo scenario and scenario in which states increased vaccination rate by 50% above their rate in the last week of August 2021. For additional details see “How We Conducted This Study.” Data: Authors’ analysis based on method described in Pratha Sah et al., “Implications of Suboptimal COVID-19 Vaccination Coverage in Florida and Texas,” The Lancet Infectious Diseases, in press. Source: Eric C Schneider et al., “How Many COVID-19 Hospitalizations and Deaths Can Be Averted if States Immediately Accelerate Their Vaccination Efforts?,” To the Point (blog), Commonwealth Fund, Oct. 5, 2021. https://doi.org/10.26099/xm9p-7f94


ALT social distancing, virus, distance
