

Single father, scientist, & engineer. Managed medical studies & NASA GISS project. I only respond to intelligent life. 💉I don't take experimental Medicine!
Joined August 2021
- Tweets38K
- Following5K
- Followers5.5K
- Likes69.2K

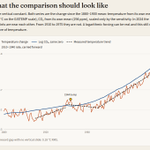
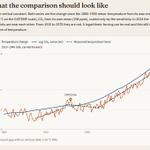




The charlatans of climate activism vs graphs based on instrumental data.
The blue line is not emissions, and it is not the CO₂ concentration. Emissions are tons per year. Concentration is the tons the air has kept (cycle time which is about 4 years). The line is a logarithm of that concentration, times a number chosen so the recent trend matches, plus a constant chosen so the pens overlap.
If industrial emissions were what the chart claims to display, the curve would have to follow the emission history: slow before 1950, a postwar step, the post-2000 acceleration, the 2020 dip. It does not. The logarithm erases those steps, and the vertical slide erases the gap. A smooth overlay is what you get after those two operations. It is not evidence that temperature is the log of anything people burned.
The radiative forcing of a given CO₂ concentration is approximately logarithmic. That is a statement about photons, not a license to crop the temperature record at 1959 and call the regression a measurement.
It is not a measurement, but my graph shows the best example of what it should look like based on the data.
While I don't believe in magical thermodynamics, I do believe in instrumental measurements and properly drawn graphs.
The left is a lie, the right is the honest instrumental data. It shows warming began around in 1910 to 1940, then continued along the trend from 1970 to present.
For all intents and purposes, this appears to show a trend that began before any significant CO₂ had been added from anthropogenic sources.


Science Blog retweeted
Since you insist on using your bogus graph so often, I can at least give you an accurately drawn graph using real world data.
Let me show you exactly why Michael Mann tried to hide this trend, and why your graph is bogus.
First, the blue line is not emissions, and it is not the CO2 concentration. Emissions are tons per year.
Concentration is the tons the air has kept. The line is a logarithm of that concentration, times a number chosen so the recent trend matches, plus a constant chosen so the pens overlap.
Next, let's add the temperature trends from 1910-1940 and the resumed trend between 1970 to present.
OMG! Do you see the bump, exactly where I predicted it would be near the 1940s?
Perhaps this is why so many scientists (like myself) who have spent years doing real scientific work have a somewhat logically skeptical view of the radiative forcing hypothesis.
Furthermore; human emissions would not draw that blue line!
The blue line is not emissions, and it is not the CO2 concentration. Emissions are tons per year. Concentration is the tons the air has kept. And that's an important distinction, isn't it.
The line is a logarithm of that concentration, times a number chosen so the recent trend matches, plus a constant chosen so the pens overlap.
If industrial emissions were what your chart claims to display, the curve would have to follow the emission history: slow before 1950, a postwar step, the post-2000 acceleration, the 2020 dip.
But your graph does not. Your logarithm erases those steps, and the vertical slide erases the gap.
A smooth overlay is what you get after those two operations.
It is not evidence that temperature is the log of fossil fuel usage.
The radiative forcing of a given CO2 concentration is approximately logarithmic.
That is a statement about photons, not a license to crop the temperature record at 1959 and call the regression a measurement.
So, stop posting your bogus graph, expecting it to have an effect on someone who has spent a lifetime doing the real scientific work!
The graph is still not a picture of temperature, but a logarithmic forcing is an idealized BS answer and should be rejected based on observational evidence and cycle time physics.

Science Blog retweeted
I find that people who can't articulate their own words use phrases like "word salady" because they're just pretending to speak intelligibly about things they don't fully comprehend and are caught assuming everyone is as dumb and uneducated as they are about the subject.
Science Blog retweeted
1°C and 100 ppm in 60 years is NOT unprecedented. I don't get my paleoclimate history from fraudsters.
Paleoclimate reconstructions have methodological limits. Proxies (tree rings, sediments, ice cores, etc.) vary in resolution, seasonal bias, spatial coverage, and dating precision.
It's all performance art orchestrated by believers with biases. Many papers and reviews diverge from the IPCC assessment. And the research doesn't agree.
You can't compare a proxy to instrumental data and declare that 1°C and 100 ppm in 60 years is unprecedented!
Many reconstructions show faster rates with CO2 and temperature. Especially within the last 2000 years. The further we go back in paleoclimate history, the less precise it is.
There's a potential of 1-7 degrees of difference in temperature and CO2 could have been higher than 450 ppm during the RWP.
I don't choose to believe liars anymore. I'll figure it out on my own from now on.
Denial isn't a river in Egypt, it's the activists and their climate doomsday fear porn.
"deny it's happening and another to admit it and say it is trivial"
So far in the Common Era, both temperature changes and sea-level rise acceleration have been modest by paleoclimate standards.That leaves the alarmist case with a long and documented record of failed predictions; more than 50 and counting.
Climate models have run systematically warm.
Warming itself has been exaggerated relative to observations.
Sea-level rise has been exaggerated.
Extreme weather has been exaggerated.
Paleoclimate reconstructions for temperature have been adjusted and presented in ways that overstate the uniqueness of the present. With some cases like Mann's hockeystick directly manipulating outcomes to create fraudulent narratives that hide natural variability like the 1940-1970 volcanic cooling.
Ice core data so smoothed it can't even be compared to present time scales.
Major scientific organizations have repeatedly subordinated their own data and uncertainty assessments to political messaging.
Resources are being misallocated on the basis of those exaggerated risks.
Current climate policies have no realistic prospect of meaningfully altering the global temperature trajectory.
And large parts of the public debate have abandoned basic standards of evidence and proportionality.
The pattern is consistent: overstated risks, overconfident models, and policy responses that do not match the actual data.
After all of this, you have the balls to claim it's "science denial"?
What a joke.

Science Blog retweeted

Tom Nelson Podcast #440: James Kamis: “El Nino/La Nina system generated by geological forces” is now published.
Geologist James Kamis argues El Niño and La Niña are generated by geological forces near a stationary Pacific Ring of Fire source, not primarily by trade-wind shifts. Citing cone-shaped warming/cooling patterns, helium concentrations as volcanic indicators, burst-like heat “blobs,” sharp temperature boundaries, centuries of recorded events, seafloor volcanoes, hydrothermal vents, trenches, and methane hydrate “ice rocks,” he proposes magma heat melts hydrates to create La Niña cooling and continued heating yields El Niño warming. He compares related phenomena (El Padre/La Madre), points to rapid North Atlantic warming linked to a spreading center, and says volcanic impacts may be underestimated in climate studies. He calls for more seafloor mapping and denser Argo buoy coverage.
00:00 Meet the Geologist
01:14 Geology Behind ENSO
03:09 Why Wind Theory Fails
05:16 Volcanic Evidence
10:18 Ring of Fire Origins
11:05 Ocean Floor Revealed
12:20 Undersea Volcanoes
14:20 Hydrothermal Heat Engine
16:09 Faults and Quakes
17:19 Methane Hydrates Model
20:01 Source Area Deep Dive
21:46 La Niña Mechanics
23:33 Analog Events Worldwide
27:29 Atlantic Heat Spike
29:27 Climate Change Impacts
33:25 Wrap Up and Q&A
A bar tender wrote the worst possible, most expensive 10-year federal mobilization framework in climate change nut history, to address climate change economic inequality.😆
Congress is overrun by socialist idiots.😑

Sea Level Rise (SLR) started thousands of years ago, but is there any sign of acceleartion?

Sea-level Acceleration is a Total FRAUD
There is no GMSL (global mean sea level). Sea level is a local quantity set by local geoid, local vertical land motion, local currents, local atmospheric pressure, local salinity and local temperature. Averaging height readings across an ocean with 100+ meters of real geoid variation produces a number with no physical referent, same category error as GMST (global mean surface temperature).
The satellites cannot measure the fiction either. Jason/TOPEX orbit altitude is 1336 km. Claimed trend precision is tenths of a millimeter per year. That is one part in 10^10 on a platform whose orbit determination, wet troposphere correction, dry troposphere correction, ionosphere correction, sea-state bias, inverse barometer correction, tide model, and pole tide correction each dwarf the claimed signal by orders of magnitude.
Then the splicing. TOPEX to Jason-1 to Jason-2 to Jason-3 to Sentinel-6. Each handoff gets a bias adjustment chosen by the processing team. The TOPEX-A drift correction alone was retroactively changed in 2017 and manufactured an apparent acceleration of roughly 0.05–0.1 mm/yr² overnight.
Then GIA (glacial isostatic adjustment). Add 0.3 mm/yr for a modeled rebound of ocean basins nobody measured.
Then the reference frame. ITRF (international terrestrial reference frame) updates shift the entire baseline.
Ten-plus modeled steps, every one of them a knob turned by the same people reporting the result.
The producers know every step is a human choice NOT physics.
THIS IS THE ANATOMY OF A FRAUD.

Science Blog retweeted
Not a surprise, as Congress is a constitutionally established federal legislative branch of organized crime syndication today in the business of funding smaller organized crime syndicates and Omar simply represents the Somali division of their interests. 🤔😉
It all makes sense.


Science Blog retweeted
Just going to teas you a little bit here.
But did the Zionists help us remove the ugly twin towers in NY back in 2001 or was it Islamic Terrorists.
Maybe it's time to get those "Zionists" to pay rent if they are going to spend so much time in your mind?
real-political-violence-stat…

Come on Germany, we all know the truth!
It's really 100% of the 1,087 suspects in 751 recorded gang rapes last year were foreign nationals, despite non-German citizens making up less than 17% of Germany's population.
How do we know? It went from zero to 1,087 after migration.

New figures released by the German federal government show that 53% of the 1,087 suspects in 751 recorded gang rapes last year were foreign nationals, despite non-German citizens making up less than 17% of Germany's population.
The cases involved 772 victims, of whom 619 (80%) were German citizens, including 565 women and 54 men.
The largest groups of suspects by nationality were Syrians (110), Afghans (64), Iraqis (46), and Turks (44).
The government data also shows that 72% of solved cases involved suspects who were already known to police.

Ghost Busters: A Parallel to Climate Research Grant Money
Janine Melnitz: "Do you believe in UFOs, astral projections, mental telepathy, ESP, clairvoyance, spirit photography, telekinetic movement, full trance mediums, the Loch Ness monster and the theory of Atlantis?"
Winston Zeddemore: "Ah, if there's a steady paycheck in it, I'll believe anything you say."
You're hired!
If it's not independent research, it's usually government grant money with political ties to the results. You're not going to get a grant the next time if you don't produce the results they want.

"No scientist in the field would cite Scafetta 🤡"
Really? Isn't that interesting.
Probably one of the dumbest quotes I've seen today, honestly, and I talk to activists all day.
He doesn't seem to believe in accredited scientists with Ph.D's literally working in the field.
Scafetta received a Laurea in physics from the University of Pisa in 1997 and a Ph.D. in physics from the University of North Texas in 2001.
He is a research scientist and at the University of Napoli Federico II.
He was formerly at the Active Cavity Radiometer Irradiance Monitor Satellite (ACRIM) Lab group and an adjunct assistant professor in the physics department at Duke University.
His research interests are in theoretical and applied statistics and nonlinear models of complex processes.
His doctoral thesis was titled An entropic approach to the analysis of time series.
Pretty much a leading expert in this field. The very subject this guy doesn't seem to know anything about. 👇

Science Blog retweeted

"Fauci was wrong about almost every single pandemic policy he advanced," the former FDA insider tells Reason.
reason.com/2026/10/25/public…

Stargate SG1: Notable Quote from the Book of Origin
"Blessed are the Ori" / "Hallowed are the Ori"
🤣
The book of Origin and it's believers spread Climate Model "truth". 👇
"WV feedback is considered in all models since >60 years. Maybe you should update your knowledge ?"
That's an interesting theory you have there.
Climate sensitivity to a doubling of CO2 with feedbacks may only be ~1°C, with humans contributing just 30% to the warming since 1850. Climate models are fundamentally flawed.
They cannot reproduce natural climate variability nor simulate positive water vapor and cloud feedback assumptions essential to strongly amplifying the warming thought incur from doubling CO2. Key points:
• Equilibrium Climate Sensitivity (ECS) estimates for doubled CO2 (280 to 560 ppm) plus feedbacks may be 1°C (0.7°C to 1.3°C) due to the lack of positive feedback from water vapor and clouds.
• The climate may be 5 times more sensitive to solar forcing factors (not just TSI alone) than presumed by models of radiative forcing.
• Human activity may only explain about 30% of the global warming since 1850, with warm biases in the land surface record explaining 20% and natural solar-induced variability factors explaining 50%.
• Variations in cloud albedo from 1983 to 2010 may explain 0.4°C of the global warming during this period.
sciencedirect.com/science/ar…

🌈More importantly, the average IQ in Somalia is 68.
Not a surprise Omar sucks at math.
That means that 98% of Americans are smarter than 98% of the Somalia immigrants.
You've essentially rescued 2 in 100 from a place where they actually have a chance to be competitive in their own country. Stop importing idiots, terrorists and democrats, but then I repeat myself.

Congresswoman Ilhan Omar writes in her memoir, “I was eight years old when civil war broke out in Somalia. One day everything was okay, and the next, there were bullets piercing not only buildings but also people.” While Somalia has suffered several civil wars, the chapter is entitled, “War: 1989-1991, Mogadishu, Somalia.” Mogadishu experienced severe riots in July 1989, including a mass execution that became known as the “Jazeera beach massacre.”
If, in her own words in her own autobiography, Omar was eight when this occurred in 1989, then she was born in 1981, and was 19 years old in the year 2000, when her father purportedly obtained his citizenship, not 1982 as she currently claims.

Muslim terrorists are literally the reason we can't board a plane without ID, shoes off, an invasive scan and can't have toothpaste, shampoo and conditioner.
🤔
Yet this one is saying NY elections don't need an ID.
🙄👇
Interesting, isn't that just what a terrorist would say.

Interesting how pointing out facts results in blocking me after learning that the graphic was created with a clear sky model, and does not represent a real measurement. It's just some theoretical nonsense, not a real verified fact.

This is merely a qualitative conceptual model calculation, not a direct measurement.
These spectra are generated with a line-by-line radiative transfer model (GENLN3) using the HITRAN2004 spectroscopic database and a cloud-free global-mean atmospheric temperature and gas profile.
In other words, this isn't real, nor is it real world.