

Single father, scientist, & engineer. Managed medical studies & NASA GISS project. I only respond to intelligent life. 💉I don't take experimental Medicine!
Joined August 2021
- Tweets38K
- Following5K
- Followers5.5K
- Likes69.2K

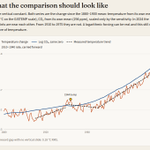
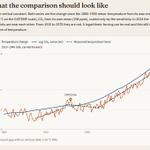



The charlatans of climate activism vs graphs based on instrumental data.
The blue line is not emissions, and it is not the CO₂ concentration. Emissions are tons per year. Concentration is the tons the air has kept (cycle time which is about 4 years). The line is a logarithm of that concentration, times a number chosen so the recent trend matches, plus a constant chosen so the pens overlap.
If industrial emissions were what the chart claims to display, the curve would have to follow the emission history: slow before 1950, a postwar step, the post-2000 acceleration, the 2020 dip. It does not. The logarithm erases those steps, and the vertical slide erases the gap. A smooth overlay is what you get after those two operations. It is not evidence that temperature is the log of anything people burned.
The radiative forcing of a given CO₂ concentration is approximately logarithmic. That is a statement about photons, not a license to crop the temperature record at 1959 and call the regression a measurement.
It is not a measurement, but my graph shows the best example of what it should look like based on the data.
While I don't believe in magical thermodynamics, I do believe in instrumental measurements and properly drawn graphs.
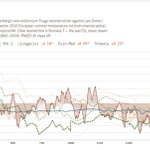
The left is a lie, the right is the honest instrumental data. It shows warming began around in 1910 to 1940, then continued along the trend from 1970 to present.
For all intents and purposes, this appears to show a trend that began before any significant CO₂ had been added from anthropogenic sources.

Yes. I rule out nonsense. I explain why it's nonsense in the first image then using REAL observational and instrumental data what the graph should look like in Image two.


Climate change is a very long process. One can't expect to rush it. Not in any way I have seen thus far.
Now if the trend data holds, we should see a leveling of the temperature over the next 5-10 years when I redraw the graph provided.

Science Blog retweeted
Since you insist on using your bogus graph so often, I can at least give you an accurately drawn graph using real world data.
Let me show you exactly why Michael Mann tried to hide this trend, and why your graph is bogus.
First, the blue line is not emissions, and it is not the CO2 concentration. Emissions are tons per year.
Concentration is the tons the air has kept. The line is a logarithm of that concentration, times a number chosen so the recent trend matches, plus a constant chosen so the pens overlap.
Next, let's add the temperature trends from 1910-1940 and the resumed trend between 1970 to present.
OMG! Do you see the bump, exactly where I predicted it would be near the 1940s?
Perhaps this is why so many scientists (like myself) who have spent years doing real scientific work have a somewhat logically skeptical view of the radiative forcing hypothesis.
Furthermore; human emissions would not draw that blue line!
The blue line is not emissions, and it is not the CO2 concentration. Emissions are tons per year. Concentration is the tons the air has kept. And that's an important distinction, isn't it.
The line is a logarithm of that concentration, times a number chosen so the recent trend matches, plus a constant chosen so the pens overlap.
If industrial emissions were what your chart claims to display, the curve would have to follow the emission history: slow before 1950, a postwar step, the post-2000 acceleration, the 2020 dip.
But your graph does not. Your logarithm erases those steps, and the vertical slide erases the gap.
A smooth overlay is what you get after those two operations.
It is not evidence that temperature is the log of fossil fuel usage.
The radiative forcing of a given CO2 concentration is approximately logarithmic.
That is a statement about photons, not a license to crop the temperature record at 1959 and call the regression a measurement.
So, stop posting your bogus graph, expecting it to have an effect on someone who has spent a lifetime doing the real scientific work!
The graph is still not a picture of temperature, but a logarithmic forcing is an idealized BS answer and should be rejected based on observational evidence and cycle time physics.
It's not settled science. Not only that, but we don't have instrumentals for anything you believe, all we have is limited proxies.
Yes, the same process but on a shorter scale between 1940-1970. This is what Mann wanted to hide. He needed the hockey stick to smooth over the warming trend that started in 1910. Thus, 116 years of warming (TSI) + variation in albedo.
Calibrations are biases as well.
It's not a conspiracy, it's a proven fact. The scientists get to provide their version of uncertainty, which once again is biased and ignores the real uncertainty in the methods and data they choose.
Yes, and proxies are sampled with biases that are often 300 years apart.
Imagine the arrogance of thinking this can be compared to the last 100 years of warming.
BTW, it's not 60 y, it started warming in 1910 and that's why Mann was so desperate to hide it.
Who gives a s*, my point is that it's all BS and you can go to one source or another and get different results.
You have your religion, and I have the realistic logical expectations for science.
Science Blog retweeted
I find that people who can't articulate their own words use phrases like "word salady" because they're just pretending to speak intelligibly about things they don't fully comprehend and are caught assuming everyone is as dumb and uneducated as they are about the subject.
I find that people who can't articulate their own words use phrases like "word salady" because they're just pretending to speak intelligibly about things they don't fully comprehend and are caught assuming everyone is as dumb and uneducated as they are about the subject.
No, reconstructions like yours smooth away all the variability until they arrive at the same kind of BS we witnessed with Mann's fraudulent hockey stick.
Real scientists don't need to commit fraud or exaggerate to convince people.

Every model predicts significant SLR acceleration. The observations show it's trivial.
Every model predicted several degrees of warming at the poles, but ONLY one pole warmed.
Every model predicted hot zones, that never showed up.
Models fail so miserably that they now use models to estimate storm intensity where there is none.
I'm pretty damn sick and tired of breathless twits pretending the world is coming to the end every few years, due to an increase in a trace gas (for which humans have added very little of) and exaggerated predictions with the words might, could just before they reveal the latest modeled nonsense. Completely ignoring the last 50 years of failed modeled predictions.
Science Blog retweeted
1°C and 100 ppm in 60 years is NOT unprecedented. I don't get my paleoclimate history from fraudsters.
Paleoclimate reconstructions have methodological limits. Proxies (tree rings, sediments, ice cores, etc.) vary in resolution, seasonal bias, spatial coverage, and dating precision.
It's all performance art orchestrated by believers with biases. Many papers and reviews diverge from the IPCC assessment. And the research doesn't agree.
You can't compare a proxy to instrumental data and declare that 1°C and 100 ppm in 60 years is unprecedented!
Many reconstructions show faster rates with CO2 and temperature. Especially within the last 2000 years. The further we go back in paleoclimate history, the less precise it is.
There's a potential of 1-7 degrees of difference in temperature and CO2 could have been higher than 450 ppm during the RWP.
I don't choose to believe liars anymore. I'll figure it out on my own from now on.
Denial isn't a river in Egypt, it's the activists and their climate doomsday fear porn.
"deny it's happening and another to admit it and say it is trivial"
So far in the Common Era, both temperature changes and sea-level rise acceleration have been modest by paleoclimate standards.That leaves the alarmist case with a long and documented record of failed predictions; more than 50 and counting.
Climate models have run systematically warm.
Warming itself has been exaggerated relative to observations.
Sea-level rise has been exaggerated.
Extreme weather has been exaggerated.
Paleoclimate reconstructions for temperature have been adjusted and presented in ways that overstate the uniqueness of the present. With some cases like Mann's hockeystick directly manipulating outcomes to create fraudulent narratives that hide natural variability like the 1940-1970 volcanic cooling.
Ice core data so smoothed it can't even be compared to present time scales.
Major scientific organizations have repeatedly subordinated their own data and uncertainty assessments to political messaging.
Resources are being misallocated on the basis of those exaggerated risks.
Current climate policies have no realistic prospect of meaningfully altering the global temperature trajectory.
And large parts of the public debate have abandoned basic standards of evidence and proportionality.
The pattern is consistent: overstated risks, overconfident models, and policy responses that do not match the actual data.
After all of this, you have the balls to claim it's "science denial"?
What a joke.
