GP @BBB_health AcademicCL @NIHRresearch @KingsMedicine Assoc Editor @BJGPJournal @rcgp ;exTrustee @Barts_Charity https://xitter.cf/t.co/BWcZwjjGBy
- Tweets9.1K
- Following4.7K
- Followers3.3K
- Likes18.3K



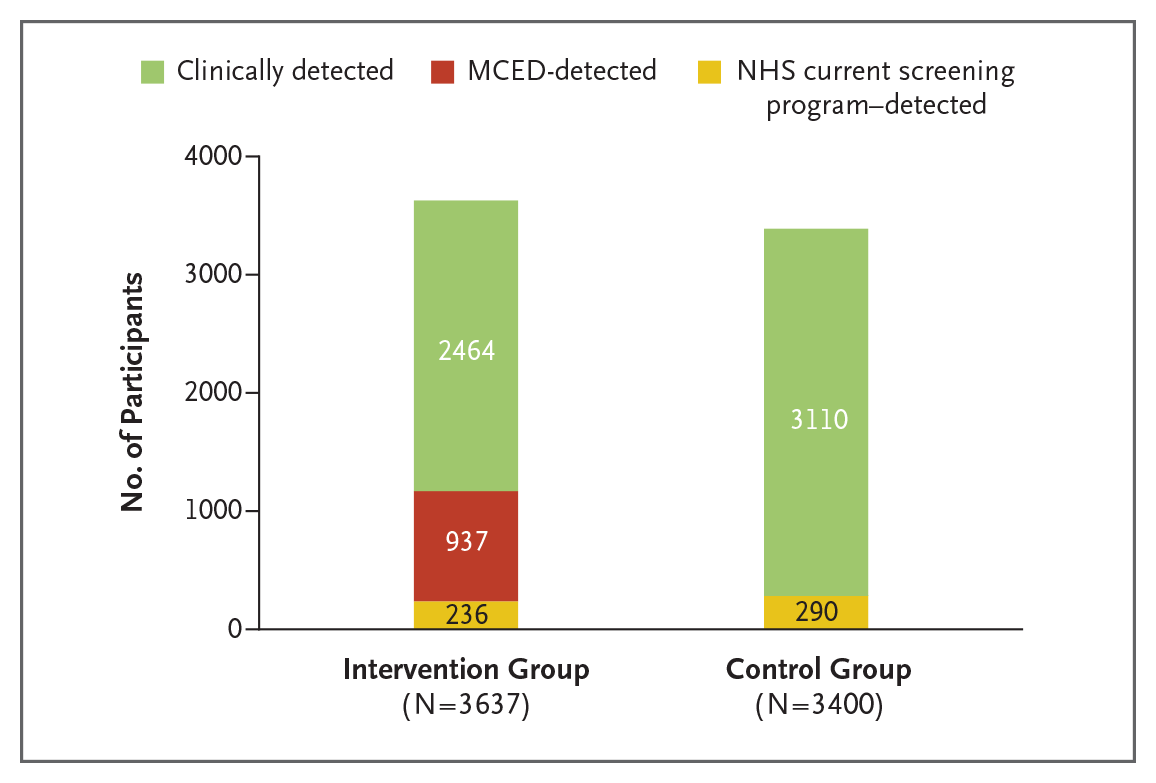
ALT Bar chart comparing detection methods of two groups, Intervention Group (N=3637) and Control Group (N=3400). For the Intervention Group, clinically detected: 2464, MCED-detected: 937, NHS current screening program-detected: 236. For the Control Group, clinically detected: 3110, MCED-detected: 0, NHS current screening program-detected: 290. The colors represent each detection method: green for clinically detected, red for MCED-detected, and yellow for NHS detection.

ALT Illustration of a multi-cancer early-detection blood testing kit with a test tube filled with blood, alongside a magnified view of a cancer cell surrounded by other cells.





ALT A bar chart from an Original Article published in the New England Journal of Medicine article titled "Effect of Screening with Multicancer Early-Detection Test on Late-Stage Cancer Diagnosis." The chart shows the distribution of the route to cancer diagnosis according to trial group after three annual screening rounds. The trial name, NHS-Galleri, is in parentheses after the title. The NEJM identity sits at the bottom.