

Stanford Prof. | political communication | digital media | China | authoritarian politics | computational social science
- Tweets126
- Following204
- Followers9K
- Likes219
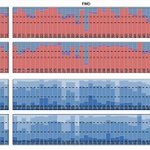





ALT Refusal to respond with mean and 95% confidence intervals.


ALT January 6 arrests and media coverage do not remobilize conservatives on social media

ALT Figure 1 Number of collected (A) tweets made by elite political influencers and (B) Gab posts made by elite political influencers and January-6-related nonelites about January 6 per day in our dataset, January 6, 2021, to April 30, 2022.

ALT Figure 2. Number of (A) media stories about January 6 and (B) arrests of January 6 defendants per day. Black dots represent dates that are two SD or more above the mean number per day.

ALT Figure 3. Histogram of the null distribution of nonparametric testing of change in volume of posts with a 30-d window before and after the focal point. The x-axis represents the change in the number of posts. The y-axis represents the number of days that demonstrated that change. The purple dashed lines represent the 95% CI. The solid, small green lines represent the change in the volume of posts for a given focal point and are sometimes overlapping. Each panel represents a platform (e.g., Twitter or Gab) and a group (e.g., White Nationalists) combination.


