

Economics & data analysis Evidence over narratives | charts & comparisons Türkiye-focused account: @World_Data_A_TR
World
Joined June 2025
- Tweets18.9K
- Following2K
- Followers6.5K
- Likes229K





Pinned Tweet
Could the world’s most dangerous conflict be Taiwan?
Yes! the world cannot absorb this conflict...
In the quoted post, several Taiwan-related variables appear to converge around 2027. It may not be visually sophisticated, but it carries a very important strategic message.
The intersection of military modernization goals, the declining probability of peaceful reunification, and the changing balance of deterrence all seem to point to the same date.
This is worth keeping in mind as we continue the Taiwan discussion.
Taiwan
Not Ukraine. Not Russia. Not even the Gulf wars.
The most dangerous conflict the world may still not be fully prepared for is Taiwan.
Because this is not only a territorial dispute.
It sits at the intersection of:
history
identity
unfinished civil war
Japan’s colonial legacy
China’s rise
the Koreas semiconductor production
global shipping
East Asia’s industrial system
And because of that, the rest of the world would not be a spectator.
Some historical background
Taiwan passed through several defining phases.
First, after the First Sino-Japanese War, Taiwan was ceded to Japan in 1895 and remained under Japanese rule until 1945. During this period, Japan industrialized the island, expanded railways, sanitation, sugar production, and education, deeply shaping its modern economic structure.
After Japan’s defeat in World War II, Taiwan was placed under the Republic of China (ROC) with Allied and U.S.-backed postwar arrangements.
Then came the decisive break: after the Chinese Civil War, the KMT retreated to Taiwan in 1949, while the People’s Republic of China was established on the mainland.
Why are people of the same civilizational root in conflict?
This is perhaps the deepest question.
At the cultural and ethnic level, there are major overlaps:
Han Chinese roots
migration waves from Fujian and Guangdong
later mainland migration after 1949
strong Japanese institutional legacy
a distinct Taiwanese civic identity today
Taiwan identiy
So the conflict is less about ethnicity and more about:
political legitimacy, sovereignty, and future alignment.
The identity trend now makes this divide even more structurally complex.
As the chart shows, the share of people identifying as Taiwanese only has risen from below 20% in the early 1990s to above 60% by 2025, while those identifying as Chinese only have fallen to nearly negligible levels.
This suggests that Taiwan is no longer shaped only by historical migration roots or civilizational continuity.
A distinct political and civic identity has clearly consolidated over time.
This makes the issue even more sensitive, because any conflict scenario would not only be about sovereignty claims, but also about a population that increasingly sees itself as politically separate.
Why the world is not ready The danger is not only military.
And... a conflict here would directly affect:
China
Japan
South Korea
both Koreas indirectly
Europe
U.S.
Chart source: @nccu1927


🇹🇼🇨🇳🇺🇸 ⏰⚔️
A strategic perspective and chart...
Why 2027 matters: When strategic “clocks” start ticking together (Taiwan, China and USA)
We may have massive crisis in 2027❗️❗️❗️
🔴 Peaceful unification window is closing: The declining red line highlights shrinking prospects for peaceful reunification as Taiwanese identity and resistance harden over time.
🟠 #Military leverage is rising: The orange line shows China’s growing perception of military advantage, reinforcing incentives to rely less on diplomacy.
🟢 #PLA modernization peaks around 2027: The rising green line reflects the PLA’s centenary goal, operational readiness for major contingencies by 2027.
🔵 Leadership timing matters: The flat blue line signals the end of Xi Jinping’s third term in 2027, a natural legacy checkpoint for decisive action.
⚖️ Clock synchronization risk: The intersection in 2027 illustrates how political timelines, military readiness, and declining peaceful options align for the first time, raising contingency risk even without an official declaration.
📌 The chart does not predict war but it explains why 2027 has become a focal point in Western and regional assessments. It is the year when multiple strategic timelines converge, making it the earliest plausible moment for #Chinese military action against #Taiwan, should #Beijing conclude that peaceful unification is no longer achievable ❗️❗️❗️
#USA #China #UnitedStates
Source: @INSSIsrael

.
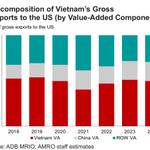
Is it correct to underestimate VIETNAM’s export development?
Vietnam’s exports to the United States rose from $47.5 billion in 2018 to $119.5 billion in 2024. According to AMRO’s decomposition (second page), Vietnam’s domestic value-added share remained broadly stable, moving from around 52% to 48%.
As seen in the chart, even with this modest decline in the share, absolute Vietnamese value-added more than doubled, from roughly $24.7 billion to $57.4 billion.
It is true that China may have rerouted some production and exports through Vietnam, and Chinese firms have expanded their presence. China has likely captured part of the gains as well. However, if the sharp rise in Vietnam’s exports to the U.S. is partly the result of supply-chain shifts away from China, then Vietnam has still benefited in absolute terms through higher domestic value-added.
Underestimating Vietnam’s export performance solely because the domestic value-added share has not risen overlooks the substantial absolute gains driven by volume growth.
AMRO’s Figures (overall value-added decomposition) and (China’s sectoral value-added shares) are attached.


World Data Analysis retweeted

Data, chart and sources: eco3min.fr/en/term-premium-d…


Vietnam is rising!
Vietnam vs China: Industrial production indices (2020 = 100)
The index measures changes in real industrial output, excluding price effects. Each country is compared only with its own production level in the base year. The charts show industrial production indices (2020 = 100), not absolute production volumes. An index of 140 means real output is 40% higher than in 2020. Each country is measured against its own 2020 level.
Key observations
Vietnam (blue) has outpaced China (red) in most manufacturing sectors since 2022–2023.
Stronger Vietnamese growth is visible in total manufacturing, basic metals, rubber and plastics, wearing apparel, leather, electrical equipment, and motor vehicles.
China remains relatively stronger or more stable in mining and quarrying and some traditional sectors.
Overall, Vietnam’s industrial output has recovered and expanded more rapidly relative to its 2020 baseline than China’s in the majority of the sectors shown.
This can be seen as assembly shifting away from China, but Vietnam is also creating real value. This could mark the beginning of a leap.
In other words, if a leap is going to happen, Vietnam is ready!
Source: @UNIDO

🇵🇱 vs. 🇩🇪 vs. 🇨🇳
Incredible Poland: Outpacing Germany and China in industrial production growth
Poland has outperformed Germany and China in industrial production growth across almost all manufacturing sectors.
Since 2020, Poland's production index has risen sharply in machinery, fabricated metals, textiles, chemicals, and several other industries. Germany's production index, meanwhile, has declined in many sectors.
(The red lines represent Poland, while the dark blue lines represent Germany and China)

World Data Analysis retweeted

Quelle fable ! Le CRIF prend donc les Algériens pour des ignorants. En 1870, la Régence d’Alger avait disparu depuis quarante ans. Le décret Crémieux n’abolissait aucune dhimmitude… Il institue une distinction entre les algériens d’une même terre. Les Algériens vivaient sur leur terre, avec leurs institutions et leur civilisation. La France coloniale les a conquis, puis a distribué les droits selon ses intérêts et ses injustices. Voilà ce que votre fable civilisatrice cherche à dissimuler. Réécrire l’histoire n’en change pas les faits. Quelle imposture intellectuelle. 🤥 un jour menteur 🤥 toujours !

#DécretCrémieux - En 1870, l’Algérie est une colonie française depuis déjà 40 ans. Les Juifs d’Algérie vivent sous le statut de Dhimmi. Mépris, humiliations et interdictions sont leur lot quotidien. Très vite, ils expriment le souhait d’acquérir la naturalisation française.
On vous parle du Décret Crémieux qui permettra à 37 000 Juifs d’Algérie d’obtenir la nationalité française.
World Data Analysis retweeted

South China sea

I hope both the Philippines and the United States are closely analyzing the route taken by the Chinese carrier strike group. Understanding its movements could provide valuable insights into potential transit routes and help both countries determine where to strategically position their offensive and defensive systems in the event of a future conflict.
Make no mistake, these deployments should not be dismissed as routine training exercises. They also provide China with valuable operational experience in waters critical to Philippine and regional security. The time to identify vulnerabilities, strengthen defenses, and prepare for potential threats is now, not when a crisis is already unfolding. In a future conflict, the difference between readiness and complacency could determine who controls these vital waterways.

.
Energy * Electrification * Final Use
I had previously shared these highly informative charts up to the letter O. With this post, we are also finishing the countries starting with P, Q and R. If there is a country you are curious about, you can search for it by country name in the posts I made.
🇵🇰 Pakistan, 🇵🇦 Panama, 🇵🇾 Paraguay, 🇵🇪 Peru, 🇵🇭 Philippines, 🇵🇱 Poland, 🇵🇹 Portugal, 🇶🇦 Qatar, 🇷🇴 Romania, 🇷🇺 Russia, 🇷🇼 Rwanda
Pakistan
Heavy reliance on natural gas and oil (domestic production + imports). Biofuels and waste also significant. Coal and nuclear present but smaller. Electricity generation mixes gas, oil, hydro, nuclear and coal. Final use is dominated by residential and industry; transport is mainly oil products. High dependence on fossil fuels and imports.
Note: The data is from 2023, and there may have been some minor changes over time
Source: @IEA

.
Energy sources, electrification, and final use
(🇳🇦 Namibia, 🇳🇵 Nepal, 🇳🇱 the Netherlands, 🇳🇿 New Zealand, 🇳🇮 Nicaragua, 🇳🇪 Niger, 🇳🇬 Nigeria, 🇲🇰 North Macedonia, 🇳🇴 Norway)
The charts put countries at the ends of that structure: wood and imported oil, hydro at the plug and gas for sale, a refinery hub, a biomass kitchen.
The Netherlands is a gas producer and an oil hub. Domestic supply is led by natural gas, with smaller biofuels, other renewables and nuclear. Imports are dominated by crude and oil products, plus some electricity. Refineries turn crude into fuels, and a large gray block is exported. Gas still reaches homes and industry. Electricity is present, not dominant. Transport remains oil.

Russia
Extremely large domestic natural gas, oil and coal production. Nuclear, hydro and some biofuels also present. Almost no energy imports. Electricity and heat are dominated by gas and coal, with nuclear and hydro contributions. Final consumption: residential and industry use large amounts of gas, heat and electricity; transport is oil. Massive gas and oil exports. Very high fossil-fuel self-sufficiency and strong gas-based electrification and heating.

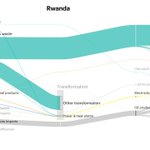
Rwanda
Almost entirely dependent on domestic biofuels & waste for primary energy. Small hydro and other renewables; oil products are imported. Electricity is limited (hydro + oil). Final use is overwhelmingly residential (biofuels for cooking/heating); transport and industry use small amounts of oil. Very low electrification; traditional biomass dominates.

World Data Analysis retweeted

Key headlines from today’s bulletin. For more information: [email protected] burumcekci.com
